Overview Dashboard
The Overview dashboard displays several metrics about how your learners are interacting with the Percipio platform as it behaves as a web site.
This dashboard allows you to gauge user interactivity with the platform. It does not show detailed learner activity regarding content launches or skills gained. You can use the detailed activity report or the executive dashboard to view those metrics.
Access the Dashboard
To access this dashboard:
- From the left navigation bar, select Analytics. Switch to the All dashboards tab.
- Select Overview.
About this Dashboard

-
 Filters

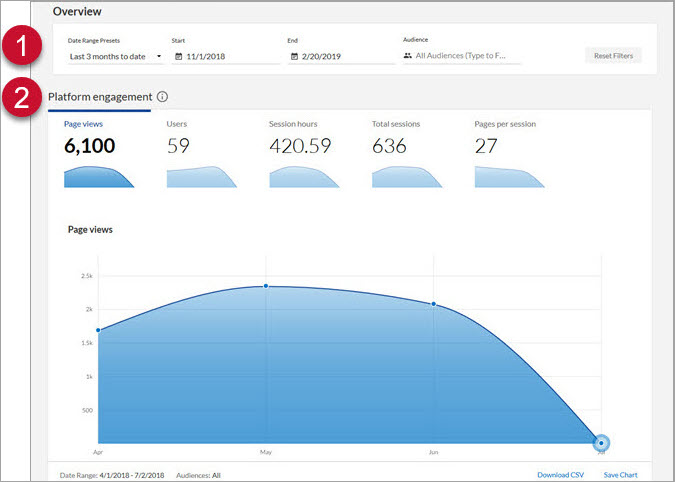
You can filter data on this dashboard by date and audience.
- Date filters: Use these to specify the data on your Activity dashboard.
- Date Range: Filters the data by a specified range of dates that you select from the drop-down list.
- Start: Instead of using a Date Range preset, use this to specify a start date. When you enter a Start date, the Date Range Presets filter changes to Custom.
- End: Instead of using a Date Range preset, use this to specify an end date. When you enter an End date, the Date Range Presets filter changes to Custom.
- AUDIENCE: Predefined group of users. Enter the name of an audience and then select it from the list. You can display the data for multiple audiences at the same time by entering more than one audience name.
Example:
If you set the date to Start on September 1 and End on October 1, only the platform data within the September 1 - October 1 time period is shown. -
 Platform engagement chart

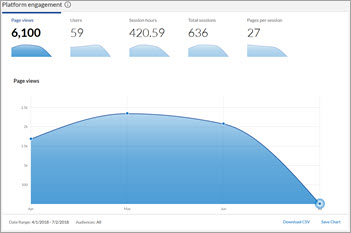
Platform engagement shows several charts related to overall usage in Percipio. When you select one of the individual metric charts, the larger graphic updates to reflect the selected data.
- Page views: Total number of platform page views for all users during the selected time frame. A page view is counted each time a user accesses a page within Percipio (whether it be through navigating through Percipio or using search).
- Examples of a page include a search results page, the Activity page, and the home page.
- Users: Total number of unique users accessing the platform during the selected time frame. Each user is counted only once, regardless of how many times they accessed the site. For example, if a learner signs in to Percipio four times within the specified date range, only one visit for this learner is included in this calculation. This does not equate to the number of licenses consumed.
- For example, if a learner signs in to Percipio four times within the specified date range, only one visit for this learner is included in this calculation.
- If the learner logged in prior to the beginning of the date range and stayed logged in throughout the date range but has no activity, they are also counted in the total number of users. This learner has an active session, but does not have activity.
- Session hours: Total time users spent engaged with the platform during the selected time frame.
- Total sessions: Total number of sessions during the selected time frame. This is not user-specific.
- For example, if a learner signs into Percipio four times within the specified date range, all four sessions are included in this calculation.
- You can configure how long a learner can stay logged into Percipio. Learners can have multiple sessions during the selected time frame.
- Pages per session: Average number of platform page views per user during a single session during the selected time frame.
- For example, if a learner signs in to Percipio three times during the specified time frame, and visited six pages during the first session, four pages during the second session, and eight pages during the third session, the average number of platform page views would be six (6 page views + 4 page views + 8 pages views = 18 page views. When those 18 page views are divided by the total number of sessions for the user – in this case, 3 – the average number is six.
To save or download this chart, see Working with the Overview dashboard charts.
- Page views: Total number of platform page views for all users during the selected time frame. A page view is counted each time a user accesses a page within Percipio (whether it be through navigating through Percipio or using search).
Working with the Overview dashboard charts
Save a chart
All charts on the Overview dashboard have a Save chart option, which saves the chart as a .PNG file for use in other documents (such as a slide presentation).
- Select Save Chart.
- Select Save File.
- Click OK.
- Right-click the chart image.
- Select Save picture as.
- Enter a file name.
- In the Save as type drop down menu, select PNG (*png).
- Select Save.
Download a chart's CSV file
You can download a CSV file with the selected chart metrics and use it to import the data into other business systems or documents.
- Click Download CSV.
- Follow your browser's prompts to save the file.