Program Value Dashboard
The Program Value dashboard provides insight into your eLearning program. The highly visual metrics, along with the detailed reports, deliver important information that you can use to understand and manage your organization's learning hours and estimated program value.
Dashboard Insights
The Program Value Dashboard gives you insights into the monetary value your Skillsoft Platform contributes to your organization. You can:
- See how your Skillsoft Platform increases the productivity and skills of your users.
- Get insights into how much your organization is benefiting from the Skillsoft Platform. If metrics do not exceed your expectations, you may consider finding new ways to utilize the platform's features in order to increase your program's value.
- Change the date range of the dashboard in order to see how the program value has changed over time.
Get Started
To access this dashboard and customize it for your needs:
- From the left navigation bar, select Analytics. Switch to the All dashboards tab.
- Select Program Value.
- To see just the data you need, specify global filters for this dashboard. You find all filters under the Filters drop down.
- Once you specify filters, select Apply filters to update the dashboard.
- Select Load default filters, then Apply filters to reset all filters to default.
Filters
The following filters are available for the Program Value dashboard:
- Date Range: Filters the data by a specified range of dates that you select from the drop-down list. You can also select a custom range from the beginning of one month to the end of the same month or the end of another month.
- Start: Instead of using a Date Range preset, use this to specify a start date. When you enter a Start date, the Date Range Presets filter changes to Custom.
- End: Instead of using a Date Range preset, use this to specify an end date. When you enter an End date, the Date Range Presets filter changes to Custom.
- Audience: Predefined group of users. Enter the name of an audience and then select it from the list. You can display the data for multiple audiences at the same time by entering more than one audience name. You can select up to 20 audiences.
About this Dashboard
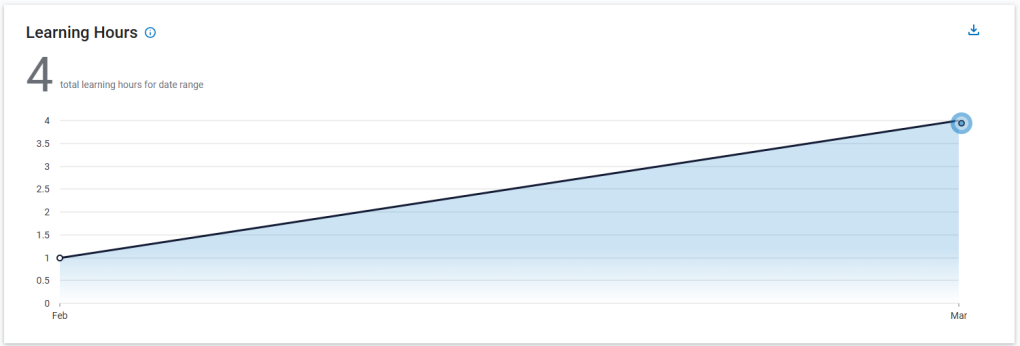
Learning hours are based on the actual time learners spend in instructional content. The Learning Hours chart is a view into the total learning hours for your organization. This important metric includes time the learner spent within any of the instructional content (including courses, books, book summaries, audiobooks, audio summaries, labs, TestPreps, tests,
Estimated Program Value chart
The Estimated Program Value chart contains the following sections:
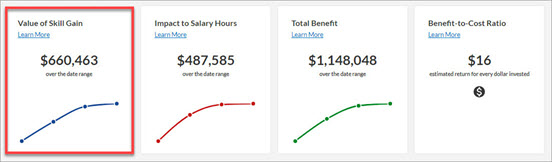
The Value of Skill Gain chart helps your organization gain insight into the increased value each employee is delivering from stronger skills obtained through eLearning. The increases in skill gain can add value in multiple ways, such as increased engagement, reduced voluntary turnover, helping the employee deliver results more consistently, and preparing the employee for more advanced work.
Value of Skill Gain calculation
This calculation is derived using the following formula:
(# users who accessed the content in a selected month) * (annual salary) * (% of tasks requiring skill) * (% skill gain) ÷ 12 (the number of months in a year) = Monthly estimate of skill gain per user.
When the selected date range is for multiple months:
1. Take the monthly estimate of skill gain per user calculation for the first month, and add it to the second month's estimate of skill gain per user calculation.
2. Add that total to the third month's estimate of skill gain per user calculation.
3. Continue adding each month into the last until you've added all monthly estimates of skill gain per user totals together to see your final Value of Skill Gain estimate.
The values applied to model the Value of Skill Gain in the platform are derived from Skillsoft's Impact Benchmarks, salary information provided by your organization, and an industry standard adjustment for self-reporting bias.
- % of tasks requiring skill = 25%
- % skill gain = 8%
- Annual salary = variable
Skillsoft's Impact Benchmark for % of tasks requiring skill (relevance) is 50 - 56%. In the platform, the low end of the range (50%) is reduced to 25% to deliver a conservative estimate. Relevance is used to isolate the impact to that portion of the job to which the improved skills apply to monetize impact for only the portion of the job role the content is affecting.
Skillsoft's Impact Benchmark for % of skill gain is 15-17%, varying by business sector. The platform uses the midpoint of 8% to conservatively estimate the improvement level occurring across your user population.
This model uses the average annual salary listed on your SETTINGS > Site Configuration page in Skillsoft Platform Admin. The default value is $50,000 USD.
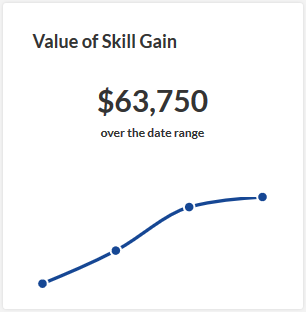
How is Skill Gain determined?
In this example, we have a Skill Gain of $63,750 over a selected date range of Jan 2019 - April 2019:
To calculate this number:
- Determine how many users accessed content in the first month of your filtered data. (This number is available via the Learner Activity report.)
- Multiply the number of users accessing the content by the average annual salary.
- Multiply that total by 25% (the % of tasks requiring skill).
- Multiply that total by 8% (the % skill gain).
- Divide this total by 12 (the number of months in a year).
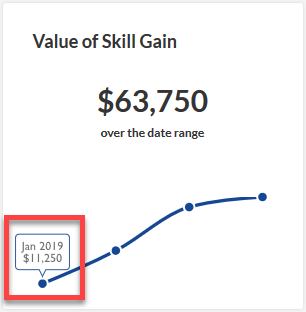
In this example: In January of 2019, 135 users accessed content.
In this example: The average annual salary is set to $50,000.
135 * 50,000 = $6,750,000
In this example: 6,750,000 * .25 = $1,687,500
In this example: $1,687,500 * .08 = $135,000
In this example: $135,000 / 12 = $11,250
You're left with you monthly Skill Gain value for January of $11,250.
Next, repeat that formula for February, and add it to the January Skill Gain total. In this example, in February 2019:
240 users accessed content * the average annual salary that was set to $50,000 = $12,000,000.
$12,000,000 * 25% (the % of tasks requiring skill) = $3,000,000
$3,000,000 * 8% (the % skill gain) = $240,000
$240,000 / 12 (the number of months in a year) = $20,000
Now that you have February's total, add it to January's total to get your cumulative total Skill Gain for both months:
$20,000 + $11,250 = $31,250
The cumulative total displays on your chart at the February point:
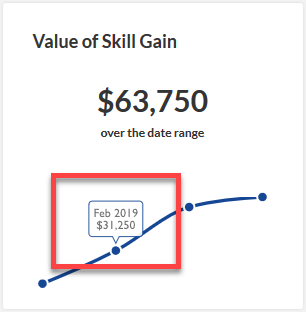
Repeat this formula for all months in your chart, adding each total to the next month, to see your total Skill Gain number for your selected date range. In the example above, the total Skill Gain number for the selected date range (Jan - Apr) is $63,750.
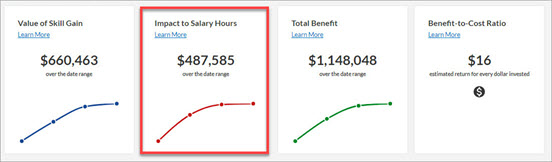
The Impact to Salary Hours chart provides insight into the value of protecting productive work time across your organization by increasing the efficiency of training delivery through eLearning. The model is based on a globally accepted industry standard that instructor-led delivery takes twice as much time to deliver the same content as eLearning1.
Impact to Salary calculation
This calculation is derived using the following formula:
(Value of training time using eLearning) * 2 = Cost of equivalent Instructor-Led training
(Cost of equivalent Instructor-Led training) - (Value of training time using eLearning) = Impact to Salary Hours estimate
**average hourly salary is roughly calculated as (40 hours/week * 50 weeks/year) / annual salary specified in Settings
The values applied to model Impact to Salary Hours in the platform are derived from industry standard comparisons of instructor-led and eLearning delivery times and annual salary information.
- # total hour of eLearning recorded in Percipio: For the time frame given, the total number of hours of eLearning consumed and recorded in the platform. Estimated Duration as reflected in the description of how each content asset consumed, is used to calculate this figure.
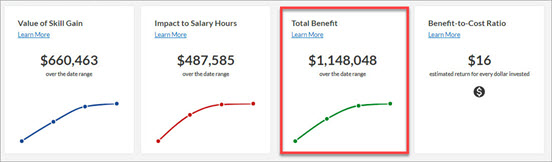
The Total Benefits chart helps you gain insight into the combined value of improving skills and protecting productive work time by increasing the speed of training delivery using eLearning.
Total Benefits calculation
This calculation is derived using the following formula:
The values applied to model Total Benefit in the platform are derived from adding the Value of Skill Gain and Impact to Salary Hours estimates.
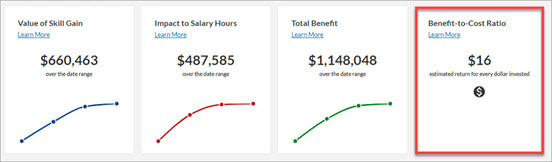
The Benefit-to-Cost Ratio estimate helps you weigh program benefits against program costs for the purpose of gauging overall impact and success of your organization's eLearning investment. The Benefit-to-Cost estimate suggests a monetized return value for every $1 USD invested.
Benefit-to-Cost Ratio calculation
This calculation is derived using the following model:
The values applied to model Benefit-to-Cost Ratio in the platform are derived from dividing Total Benefit estimate for the time period specified by your Skillsoft investment (contract value) prorated for the time period specified in your filters.
About estimates
Estimating the credible impact of a training program can be difficult. Just as the impact of an advertising program can never be known precisely, calculating the true value of learning is equally as complicated. However, reasonable estimates are a generally accepted technique for measuring learning impact as well as for decision-making in other parts of your organization. Sales forecasts, growth estimates and similar analysis are used daily to make choices about how dollars should be spent. Similarly, the estimates included in the platform's Value Dashboard are not intended to provide an exact impact figure; they are designed to produce reasonable analysis based on conservative assumptions derived from Skillsoft's value benchmarks and your organization's adoption data.
Standard adjustment: 50%
Skillsoft's current Impact Benchmarks are derived from self-reported data collected from more than 30,000 actual end users of Skillsoft content in 2014-2015. The goal of the platform's Value Dashboards is to deliver a credible monetized estimate of value without overstating the effect. Since your users have not provided the relevance and skill gain estimates as they would through a formal impact analysis, the benchmarks in the platform's Value Dashboard are adjusted by 50% to ensure no over-estimation of value.