Risk and Readiness Insights
The Risk and Readiness Insights (Risk insights for short) is designed to illuminate the areas in which your organization should focus its compliance training resources. It shows the highest risk areas faced by your organization based on statistics from your compliance training. It provides insights about your greatest compliance risks in comparison to other organizations in your industry. Use this information to prioritize your compliance efforts and allocate training resources more effectively based on the severity and likelihood of risks.
The Risk and Readiness Insights is only available if you have purchased Skillsoft Compliance Suite as part of your contract.
Insights
From the Risk and Readiness Insights, you can see how:
- The areas of compliance in which your organization is falling behind. By knowing your highest risk areas, you are able to focus training towards these areas and remind users of the importance of meeting organization standards. All Skillsoft compliance courses are mapped to a risk area.
- The areas of compliance in which your organization is excelling. See areas in which your organization faces the least threat, and use this information to help strategize how to bring all areas up to this standard.
- All active compliance assignments made in the platform including the number of learners assigned, and the completion percentages. Use this information to make sure learners are keeping up with their compliance assignments, and encourage those who may be falling behind.
- All compliance course assessments including the scores achieved by learners, and how many attempts it took them to pass. Use this information to see which areas your learners are excelling at, and which they may be struggling with.
Get Started
To access the Risk insights:
- From the left navigation bar select Analytics. Switch to the All Dashboards tab.
- Select Risk and Reading Insights. The page displays.
- Set filters and select Apply filters. You can set global date filters and audience filters for the Training Risk Areas in Detail section.
- You have the option to turn on the setting Show Industry Benchmarking. When this setting is on, you see how your risk analytics compare to other organizations in your industry.
- Download the Training Risk Areas in Detail by selecting the Download as CSV button. The CSV displays the data based on the filters you have selected.
Filters
Filters you can set include:
-
Date Range: Filters the data by a specified range of dates that you select from the drop-down list. Alternatively, use the calendar view to select a custom date range for your data.
-
Audience: Predefined group of users. Enter the name of an audience and then select it from the list. You can display the data for multiple audiences at the same time by entering more than one audience name. You can select up to 20 audiences. Note, you can only set Audience filters for the Training Risk Areas in Detail section.
About Risk and Readiness Insights
If you choose to turn on the setting Show Industry Benchmarking, you see how your organization compares to others in your industry. Benchmarking data is aggregated and anonymized such that comparisons are made at an industry level, not against individual organizations. This helps determine whether risk exposure is higher, lower, or aligned with industry norms.
The industry used for benchmarking is derived from your organization’s configuration. As an administrator, you can update your organization’s industry by navigating to Site Configuration > Site Features > Organization Details. Any updates you make here are automatically reflected in industry benchmarking comparisons. This ensures benchmarking insights remain accurate and aligned with the organization’s current industry classification.
If you keep the setting Show Industry Benchmarking off, you only see organization-specific data.
Each risk area is assigned a Risk Score that represents the overall level of compliance risk associated with that area. The risk score is calculated from a combination of Key Risk Indicators (KRIs) which each reflect a different dimension of compliance health. KRIs are evaluated together to determine the overall risk score on a scale of 0-100 for a specific risk area. That score is then correlated to a risk level (low, medium, or high) for each risk area.
The following KRIs contribute to the risk score in the Basic version of Risk Dashboards:
- Completion Risk: Learners who have not completed required or assigned training.
- Overdue Risk: Learners who are past their training due dates.
- Assessment Risk: Learner performance in assessments, including low scores or failed attempts.
Together, these KRIs provide balanced insight into participation, timeliness, and knowledge validation.
The Risk Scores are calculated based on the following:
- The overall Risk Score is calculated across all audiences and based on the selected date range. This provides a consistent, organization-level view of risk at the risk area level.
- Detailed analytics within each risk area are recalculated based on the selected audience and date filters. This ensures high‑level risk remains stable for prioritization, while still allowing targeted analysis in detailed views.
For customers who use a third‑party LMS to manage assignments:
- Assignment‑related metrics such as completion and overdue status are not included in the risk calculation.
- The risk formula considers only assessment performance based on how learners perform when they attempt compliance course assessments in Percipio. This ensures risk scores accurately reflect the data available within Percipio and avoids misleading interpretation.
The Risk and Readiness Insights contains the following sections:
This section highlights areas that require immediate attention because this is where your organization is at the highest risk. It provides a ranked view of risk areas highlighting the one that have the highest overall risk scores.
For each risk area you see:
- The risk level (low, medium, or high).
- The training risk level in your organization.
- The breakdown of the associated course assessment performance of users in your organization.
Use the tabs at the top of this section to navigate between the different training risk areas. When you select an area, you see your risk level for that area at the top if there is available data. For each area you also see two tabs, Timeliness and Assessments.
You can choose which risk areas display and their display order. To change the display:
- Select Edit.
- Select only those risks that are relevant to your organization.
- Click and drag to reorder the risk list.
- Select Save to save changes.
- Select Close to return to the Risk dashboard.
You can view data about a risk area in one of the following tabs:
- Timeliness: Shows data about the completions of assignments related to that area of risk for learners in your organization.
- Assessments: Shows data about assessments scores for that risk area for learners in your organization.
Timeliness
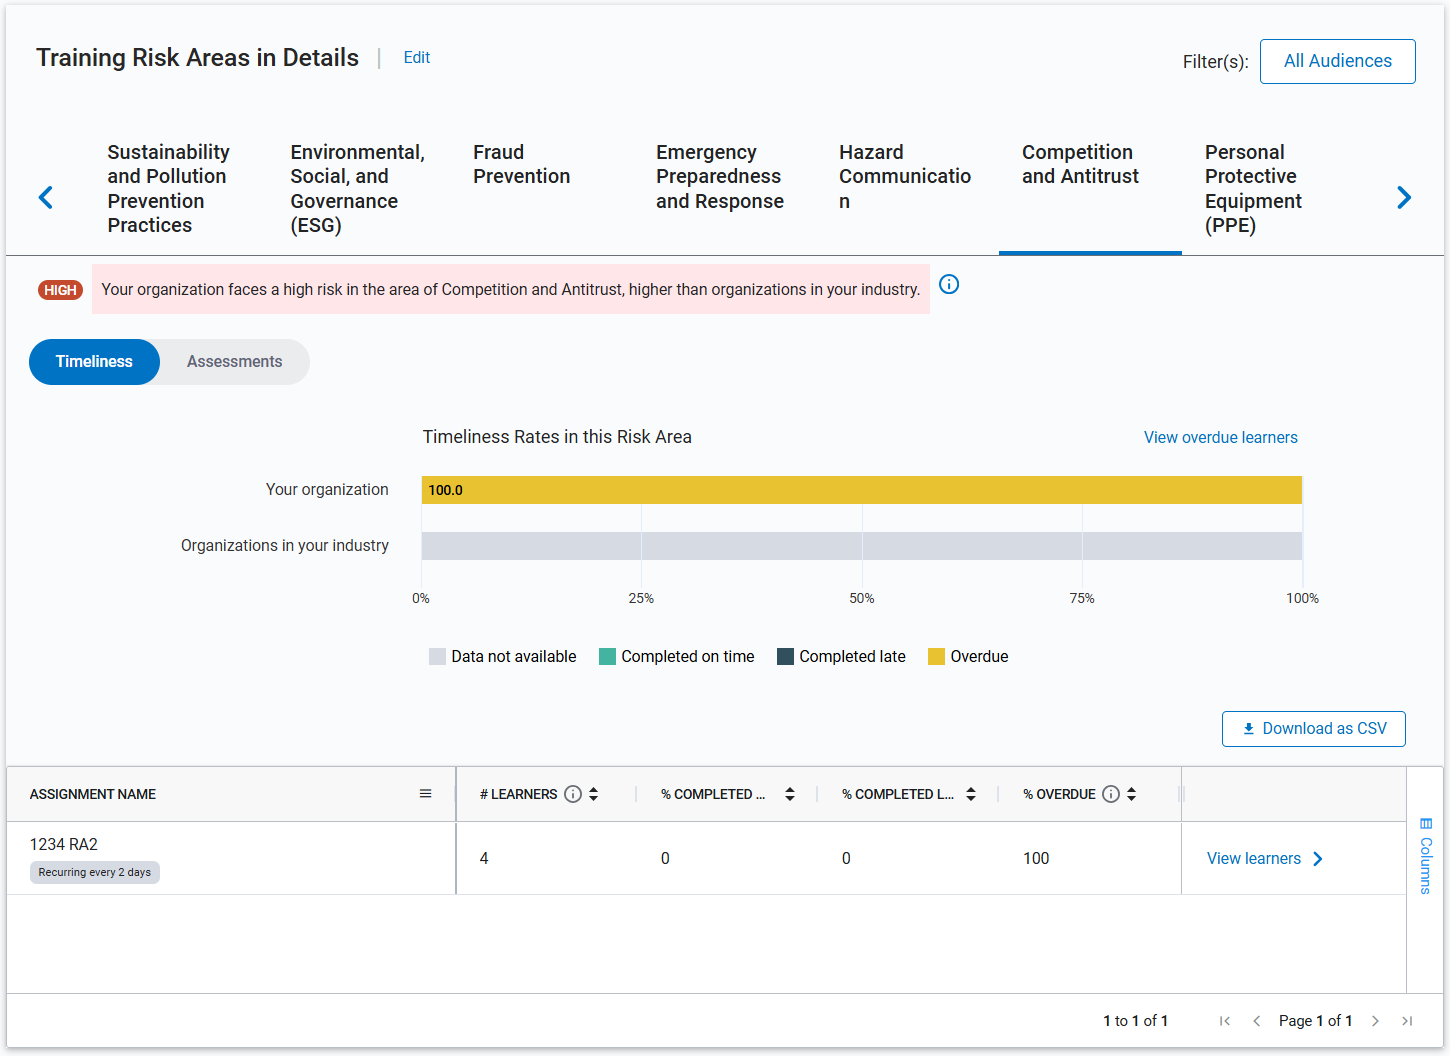
When you select the Timeliness tab for a risk area, you see a chart that ranks how well learners did at completing an assignment that contains content associated with that risk area. You see how many completed on time, how many completed past the due date, and how many are currently overdue. You can compare this to industry standards if you turned on the Show Industry Benchmarking feature. You only see data in this section if you have made assignments in the platform with compliance content associated with risk areas.
The columns available in the Timeliness tab include:
- ASSIGNMENT NAME: The name of the assignment that relates to given risk area.
- # LEARNERS: The number of learners assigned to the given assignment.
- % COMPLETED ON TIME: The percentage of learners who completed the assignment before the due date.
- % COMPLETED LATE: The percentage of learners who completed the assignment after the due date.
- % OVERDUE: The percentage of learners who have not completed the assignment after its due date has passed.
- View learners: Select View learners to see information about the individual users assigned to the given assignment. You can download this list as a CSV. You see information including:
- LEARNER NAME: The name of the learner assigned to the given assignment.
- EMAIL ADDRESS: The value entered in the Email address user attribute; the user's email address.
- # OF RECURRENCES: The number of times a learner returned and re-completed the content.
- COMPLETION STATUS: The user's completion status on the assignment. Values for this column are Started, Completed on time, Completed late, and Overdue.
For customers who use a third‑party LMS for assignments:
- Assignment‑related data is not available in the Timeliness tab.
- Timeliness metrics are also excluded wherever assignment data is displayed within the dashboard.
- The Timeliness tab displays informational messaging explaining that assignment data is not shown because assignments are managed outside Percipio.
This ensures transparency and helps prevent misinterpretation of risk data.
Assessments
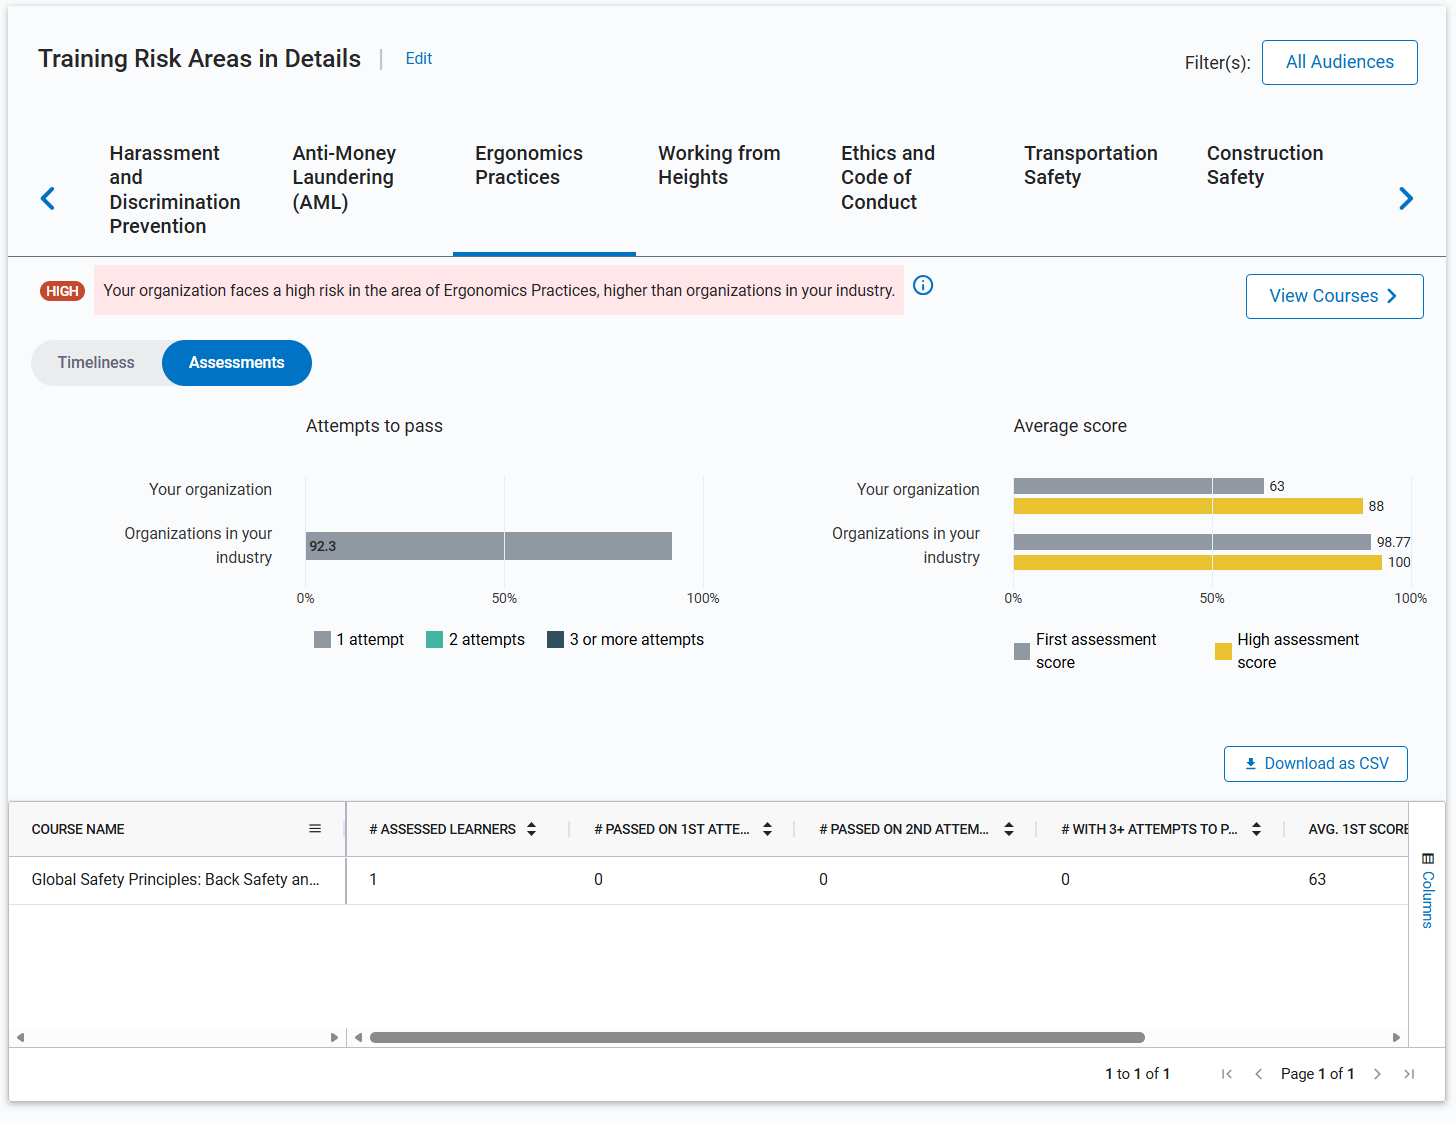
When you select the Assessments tab for a risk area, you see , you see at the top two charts:
- Attempts to pass: This shows how many attempts it took learners to pass the associated test.
- Average score: This shows the average score for all first attempts and the average high score at your company compared to the industry average.
Select View Courses to see all courses associated with the particular risk area. From this pull-out pane, you can download a CSV of the courses table. The columns in this table include:
- COURSE NAME: The name of the course relating to the selected risk area.
- COURSE CODE: The unique identifier of the course in the Skillsoft Platform.
- LANGUAGE: The language of the course.
The columns available in the Assessments tab include:
- COURSE NAME: The name of the course relating to the selected risk area.
- # ASSESSED LEARNERS: The total number of learners that completed the course assessment.
- # PASSED ON 1ST ATTEMPT: The number of learners that passed the course assessment on their first attempt.
- # PASSED ON 2ND ATTEMPT: The number of learners that passed the course assessment on their second attempt.
- # WITH 3+ ATTEMPTS TO PASS: The number of learners that took three or more attempts to pass the course assessment.
- AVG. 1ST SCORE: The average score learners receive on the first attempt at the course assessment.
- AVG. HIGH SCORE: The average of the highest scores received by learners on the course assessment.
You can download the Assessment scores as a CSV file for further analysis in your data systems.