View Chart Data
On the My Dashboard page, some charts provide options for viewing additional data or displaying the data table with filters applied.
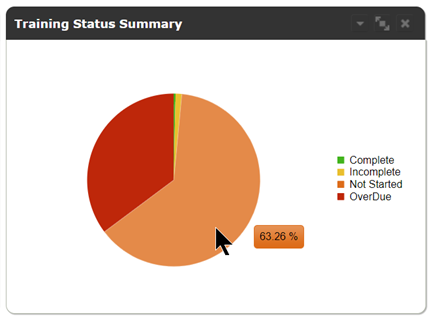
Display percentages
Hover on values to display percentages.
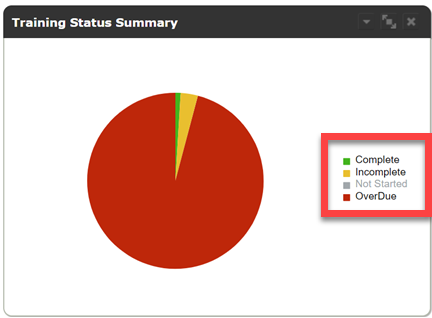
Hide values
Click a value name to hide it.
View a filtered data table
Click a section of the chart to see the data table, filtered for that value.
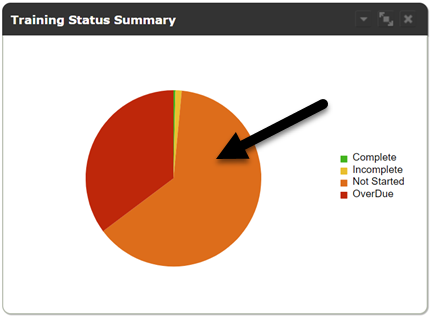
The data view launches and is automatically filtered for that value.
View unfiltered chart data
You can view the data used to create an individual chart.
- On the My Dashboard page, click More Options on the desired chart.
- Click View All Data.
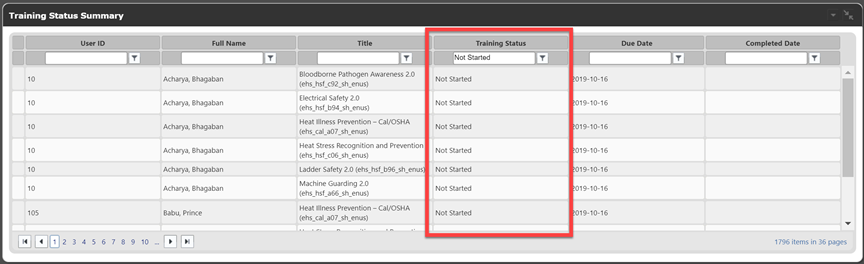
The chart data displays in tabular format where you can:
- View data such as user ID, full name, course title, training status, due date and completed date.
- Sort data by clicking the column headers.
- Filter data by entering search criteria in the desired columns and selecting a Filter option.
- View additional pages of the data with the navigation buttons below the table.
- Select More Options in order to edit the chart, view the chart, or export the data to CSV.
- Click Expand to return to the dashboard view.