Learning Program and Assignment Dashboard
The Learning Program and Assignment dashboard shows a visual summary of how many active learning programs and assignments you have, a summary by category of the number of learners in each, and the number of completions by category. You can filter the dashboard on business objective to really understand the impact that learning is having on your organization.
Use this dashboard to answer questions like the following:
- How many active learning programs and assignments do I have?
- How many learning programs and assignments are aligned to each category? Does the alignment match to my corporate learning and business initiatives for this year?
- How many completions are there per category?
- What is the percent complete per category based on those assigned or enrolled? Is this tracking to my achieving the corporate learning and business initiatives?
- How many learners have started, not started, or completed a particular program or assignment?
- How is one group of learners doing compared to another in progressing through the program or assignment?
Report Insights
With this dashboard, you can gauge whether your learning programs and assignments are aligning to your business and learning initiatives for the year and how your learners are progressing through them.
For example, if you have an initiative to upskill your workforce on AI, but most of your assignments or learning programs are categorized for onboarding, you might want to adjust. Similarly if you have an initiative for compliance, you can quickly see how many learners are on track for completing those programs and assess whether your company is at risk of non-compliance.
For each program or assignment, you can also see detailed information per user as to their progress so you know who to send reminders to. And for those assignments and programs that are assigned to larger populations, you can do a comparison between different groups based on user attributes. For example, if you assigned AI content to your entire company as an upskill initiative, and you have user attributes set up for department and geography, you can compare which departments are making the most progress and only send reminders to those who are not progressing as expected, or use the comparison as a friendly rivalry to motivate teams to complete them.
Access the Dashboard
To access this dashboard:
- From the left navigation bar, select Analytics. Switch to the All dashboards tab.
- Select Learning Programs.
Set your filters
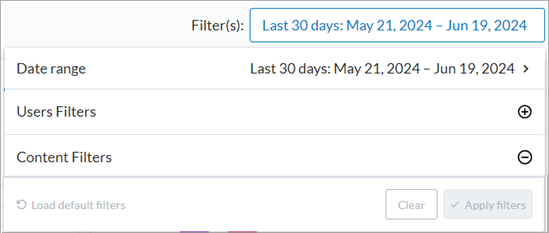
You find all filters under the Filters drop down.

You can filter data on this dashboard by date range, audiences, title, and business objective. After you set filters, select Apply filters to update the data shown on the page. If you want to reset filters, you can select Reset to default.
Filters you can set for this dashboard include:
- Date Range: Filters the data by a specified range of dates that you select from the drop-down list.
- User filters: Under the Users filter option, you may see options for Audiences and Users. Select the plus to expand the option you want to specify. Search for the audiences or users you want to see, then select them from the list. You can perform multiple searches and make multiple selections and see them on the Selected tab. When you are done selecting all audiences or users, select Apply filters to return to the main filter list or expand the next filter group.
- Include Inactive users: Select if you want to include users whose account status has been set to inactive because they left the company or went on leave.
- Content title: There are two filters under this section. Use these filters if you want to just review specific learning programs and assignments or learning programs and assignments assigned to specific business objectives.
What you select for filters here impacts what you see on the rest of the page.
Review your results
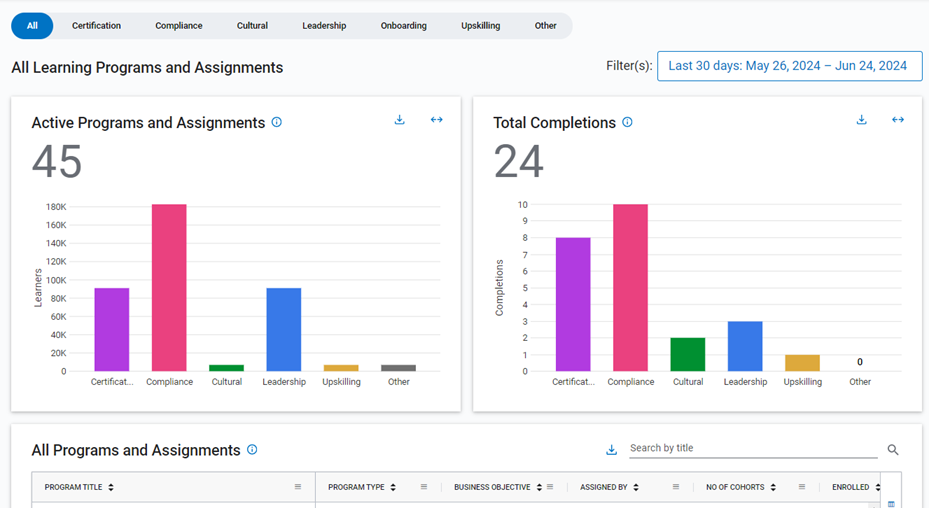
This data displayed on the dashboard reflects the filters you set. For each section you can download the data set or move it to a new location on the page. You can also use the tabs across the top to see learning programs and assignments associated with only one business objective.

You see the following sections:
In this section you see the total number of learning programs and assignments that are active.
You then see a graph that shows how many active learners are associated with each category. When you hover over a bar in the graph, you see how many learning programs and assignments are associated with the category along with the total number of learners. Waived assignments are tracked as completed assignments.
You can use this graph to gauge whether your learners are distributed across categories in the right proportions as defined by your business goals and initiatives. For example, if you have a big corporate initiative to upskill your employee base, but most of your learners are participating in cultural learning activities, this might be a red flag for you to adjust your focus.
In this section you see the total number of learners who completed programs and assignments associated with each category. When you hover over the bar, you also see the percentage of learners complete based on the total learners assigned or enrolled.
You can use the data in the graph to see where you might want to initiate reminder campaigns, or decide enough learners are complete and archive a program or assignment.
In this section you see a list of all programs and assignments and their corresponding data based on the filters set. With this list you can:
- Download the list as a CSV file to get the entire list based on filters set that you can use for further data analysis.
- Customize your view by sorting, filtering, ordering and choosing columns of data to show. For instructions, see Organize columns in tables.
- Select the hyper-linked title in the list to get more information about a particular program or assignment.
The columns available for this section include:
- PROGRAM TITLE: The title of the assignment or learning program.
- PROGRAM TYPE: Indicates whether the item is an assignment or learning program.
- BUSINESS OBJECTIVE: The business objective that is linked to the item. For a complete listing of available business objectives, see Business objectives.
- ASSIGNED BY: The first and last name of the person that assigned the item.
- NO OF COHORTS: If the item is a learning program, this shows how many cohorts the learning program has associated with it.
- ENROLLED: The number of learners actively participating in the program or assignment.
- STARTED: The number of learners who launched at least one piece of content in the program or assignment.
- STARTED %: The percent of learners who started the program or assignment based on the total number enrolled.
- COMPLETED: The number of learners who completed all content in the program or assignment.
- COMPLETED %: The percent of learners who completed the program or assignment based on the total number enrolled.
- OVERDUE: The number of learners who did not complete all content in the program or assignment by the due date specified.
- OVERDUE %: The percent of learners who did not complete the program or assignment based on the total number enrolled.
After you select the hyper-linked title of a program or assignment, you see a detailed dashboard for just that title based on the global filters set.
This dashboard has two tabs: Overview and Compare.
Overview tab
The Overview tab shows you details about each learner enrolled or assigned the title selected.
In the Progress chart you see the total enrolled or assigned and then based on the due date, you see how many started, how many started and are overdue, how many not started, how many not started and are overdue, and how many completed. Use this to gauge where you might need to send reminders.
Below the chart is a table showing all users assigned or enrolled in the title. For each learner, you see columns for:
- USER ID: The value entered in the User ID field. It is used to identify a user inside Percipio.
- FIRST NAME: The value entered in the First name user attribute. Usually the user's first name.
- LAST NAME: The value entered in the Last name user attribute. Usually the user's last name.
- PROGRAM STATUS: The status of the program or assignment based on user progress through it (Started, Not Started, Complete) unless the assignment or program is archived, then it shows Archived.
- DUE DATE: The date the assignment or program is (or was) due.
- DAYS OVERDUE: The number of days from the due date in which the user has not completed the program or assignment.
The following columns are also available:
- USER UUID: This is a universally unique identifier that is automatically assigned by the system for each account.
- LOGIN NAME: The value entered in the Login name attribute for the user.
- EMAIL ADDRESS: The value entered in the Email address user attribute; the user's email address.
- USER STATUS: The status of the user in Percipio. Valid values are active or inactive.
- COHORT NAME: If the item is a program, this is the name of the cohort the learner is enrolled in.
- User Attributes (varies): These fields are defined by (and are unique to) your organization. For more information, see User Attributes. If you are using an attribute type of Percipio User, the value in the field can be either first and last name, email address, login ID, or external user ID. The value that appears depends on what has been specified for the individual user.
Compare
On the Compare tab, you are able to compare the progress of different groups of users through the assignment or program by selecting a User Attribute. You can select up to two list attributes and they stay selected until you change them.
For example if you have a compliance assignment and want to compare which regions have completed it, you can select your Region attribute which might have values defined for North America, South America, Europe, and Asia. You then see for each attribute value a graph of the number of learners assigned that value and who have a status as indicated in the tabs across the top. Select different tabs across the top to see the different progress points through the assignment or learning program.