Skill Benchmarks Overview Dashboard
The Skill Benchmarks Overview dashboard shows a visual summary of your organization's proficiency of skills that have been measured by completing a skill benchmark. This dashboard allows you to see how proficient your learners are on a variety of skills, and how their skills have improved with additional learning.
Dashboard Insights
The Skill Benchmarks Overview Dashboard gives you insights into what Skill Benchmarks your learners are completing and how they are scoring. You can:
- See what skill benchmarks your learners taking. From this, you can gain insights into the most popular skills being developed in your organization.
- Check how many learners are engaged in learning skills through benchmarks.
- Gain insights into which skills have the highest level of proficiency, which have increased the most, and which still need improvement.
- See how you might need to tailor programs based on results. If many users rank in the Novice or Aspiring categories, you might consider assigning additional content for this skill. Conversely, if many learners score in the Proficient or Advanced categories and only a few score in Novice, you can tailor programs just for the Novice users and assign Proficient users to the next highest skill set.
- See what skills your users are focusing on and if they align with your corporate business objectives. If you configured audiences for department and job role, you can get a sense of the skill level of different departments or job roles by using the audience filter to see the skill benchmarks accessed and the scores achieved.
Get Started
To access this dashboard and customize it for your needs:
- From the left navigation bar, select Analytics. Switch to the All dashboards tab.
- Select Skill Benchmarks.
- To see just the data you need, specify global filters for this dashboard. You find all filters under the Filters drop down.
- Once you specify filters, select Apply filters to update the dashboard.
- Select Load default filters, then Apply filters to reset all filters to default.
Filters
You can filter data on this dashboard by date range, audience, and benchmark. After you set filters, make sure to select Apply filters to update the data shown on the dashboard. Filters you can set include:
- Date Range: Filters the data by a specified range of dates that you select from the drop-down list.
- Start: Instead of using a Date Range preset, use this to specify a start date. When you enter a Start date, the Date Range Presets filter changes to Custom.
- End: Instead of using a Date Range preset, use this to specify an end date. When you enter an End date, the Date Range Presets filter changes to Custom.
- Audience: Predefined group of users. Enter the name of an audience and then select it from the list. You can display the data for multiple audiences at the same time by entering more than one audience name. You can select up to 20 audiences.
- Benchmark by keyword: To narrow your focus to one or more specific benchmarks or group of benchmarks, enter keywords of benchmarks. Use this filter if you want to just review benchmarks on a particular subject such as java or python that may have many levels of skills to measure. The benchmarks you select here impact what you see on the rest of the page.
- Inactive users: Select if you want to include inactive users in your counts. If you include inactive users, you may not get an accurate picture of your organization current skill levels specially if those inactive users left your company.
About this dashboard
This dashboard contains the following sections.
In this overview section you see:
- Total benchmarks completed: The total number of benchmarks completed in the specified date range. If one learner took a single benchmark 8 times, each time the learner took the benchmark is added to the overall count, in this case 8. If one learner took six different benchmarks one time each, the count goes up by 6.
- Unique benchmarks completed:The number of unique benchmarks completed in the specified date range. If one learner took a single benchmark multiple times, that is only counted as one unique benchmark. If multiple users completed the same benchmark, that is only counted as one unique benchmark.
- Unique learners: The number of unique learners who completed a benchmark in the specified date range. If one learner completed more than one benchmark or one benchmark multiple times, they are only counted once.
- Improvements: The total number of score increases by learner counted once for each skill benchmark they took. If one learner took a single benchmark multiple times and increased their score each time the took it, that is only counted as 1 improvement. If 7 learners each took the same skill benchmark a second time and only 6 increased their score from the previous time, that is counted as 6.
You can select View details by learner to view the Skill Benchmark Learner Details report
On this tab you see a list of the top 10 most accessed skill benchmarks based on the filters set. The list is initially sorted by the highest number of unique learners who accessed each benchmark. You can sort by any of the columns.
For each benchmark you see:
- Skill Benchmark: The name of each skill benchmark. If you select the name, you can view additional details of that one benchmark.
- Unique learners: The number of unique learners within the specified date range who completed each benchmark.
- Score range: Of all the unique learners who completed the benchmark within the date range, you see the breakdown by level of each users' highest score. Score values mean the following for the learners:
- Novice (0-9 points): Novice means that you are starting with very limited familiarity on the topics critical for the skill.
- Aspiring (10-49 points): Aspiring means that you have demonstrated minimal capabilities for the specific skill and should make an investment in learning to achieve proficiency.
- Developing (50-69 points): Developing means that you have some proficiency with the specific skill and only need to close a few knowledge gaps to achieve proficiency.
- Proficient (70-89 points): Proficiency means that you have met the criteria for applying your knowledge with the skill to practical challenges in your work. We recommend you strive to achieve a minimum level of Proficiency for the skills you are developing.
- Advanced (90-100 points): Advanced means that you demonstrate a thorough understanding of the skill and may be a candidate to mentor other learners within your organization.
On this tab you first see an overview of how much skill learners gained across all benchmarks taken based on the filters set. Data that you see includes:
- Reassessment: The total number of retakes per skill benchmark counted by unique learners during the specified date range.For example: If your date range is 60 days, and learner A takes a skill benchmark on day 1, day 30 and day 60, that would be only 1 reassessment. If learner B in that same time frame takes a skill benchmark on day 25 and again on day 55, that is 1 reassessment. If learner C takes their first skill benchmark prior to the date range, and the second skill benchmark within the date range, that is not considered a reassessment. If you add all reassessments together in this case, you get total reassessments to be 2.
- Unique learners increased score: The percent of learners within the specified date range who retook a skill benchmark and increased their score counted by benchmark. For example: If your date range is 60 days, and learner A takes a skill benchmark on day 1, day 30 and day 60 and increased their score both times, that would be 1 learner with a reassessment who increased their score. If learner B in that same date range takes a skill benchmark on day 25 and again on day 55, but doesn't increase their score, that is a learner with a reassessment who didn't increased their score. If learner C takes 2 different skill benchmarks within that date range and increases their score in both benchmarks that is counted as 2. If learner D takes their first skill benchmark prior to the date range, and the second skill benchmark within the date range and increases their score, that is not considered a unique learner with a reassessment, so that is 0. So that is 3 out of 4 learners with a reassessment who increased their score or 75%.
- Average score increase: Of all the unique learners who took a reassessment within the specified date range, take all unique learners who improved their score and average the difference in scores together. For example: If your date range is 60 days, and learner A takes a skill benchmark on day 1, day 30 and day 60 and increased their score from 34 to 50 to 75 each time, that would be a total difference of 75-34=41. If learner B in that same time frame takes a skill benchmark on day 25 and again on day 55, but doesn't increase their score, that total difference is considered 0 and not included in the average. If learner C takes their first skill benchmark prior to the date range, and the second skill benchmark within the date range and increases their score, that is not considered in the average. If learner D takes a skill benchmark on day 14 and day 44 and increases their score from 52 to 81 that would be a total difference of 81-52=29. So the average is calculated for learners A and D at (41+ 29)/2 = 35 average increase.
- Proficient learners: Total learners with a proficient score of at least 70, counted per benchmark within the specified date range.For example: If your date range is 60 days, and learner A takes a skill benchmark on day 1, day 30 and day 60 and increased their score from 34 to 71 to 95 each time, that would be 1 proficient learner. If learner B in that same time frame takes two skill benchmarks both on day 25 and again on day 55, with a first score of 60 and a second score of 58 on one benchmark, and a first score of 65 and a second score of 86 on the second benchmark, that is one proficient learner. If learner C takes their first skill benchmark prior to the date range, and the second skill benchmark within the date range with a second score of 78, that is considered a proficient learner. If learner D takes the same skill benchmark as learner A on day 14 and day 44 and increases their score from 52 to 81 that would be one proficient learner. So the total number of proficient learners would be 4.
The detailed list shows the same data for each skill benchmark initially sorted by the % of unique learners that are proficient. You can sort by any of the columns.
For each benchmark you see:
- Skill Benchmark: The name of each skill benchmark. If you select the name, you can view additional details of that one benchmark.
- Unique learners: The number of unique learners within the specified date range who completed the benchmark at least once.
- Reassessment: The total number of retakes per skill benchmark counted by unique learners during the specified date range.
- % of Learners with Increased score: The percent of unique learners within the specified date range who increased their score.
- Average score increased: Of all the unique learners who took a reassessment within the specified date range, take all unique learners who improved their score and average the difference in scores together.
- Proficient (#): Total learners with a proficient score of at least 70, counted per benchmark within the specified date range..
- Proficient (%): Of all learners who took a skill benchmark within the date range, the percentage of them who have a best score that is at least a 70 counted per benchmark.
In this section you see a list of all skill benchmarks and their corresponding data based on the filters set. With this list you can:
- Download as CSV: download the entire list based on filters set into a CSV format that you can use for further data analysis.
- Customize your view by sorting, filtering, ordering and choosing columns of data to show. For instructions, see Organize columns in tables.
- For each skill benchmark, you can view the question-level report.
The columns available for this section include:
- Skill Benchmark: The name of the skill benchmark. If you select the name, you can view additional details of that one benchmark.
- Content Type: The type of benchmark.
- Unique learners: The number of unique learners who completed the benchmark.
- Benchmarks completed: The total number of benchmarks completed. If one learner took this benchmark multiple times, each time the learner took the benchmark is added to the overall count.
- Novice %: the percent of unique learners whose best score was between 0 and 9%.
- Aspiring %: the percent of unique learners whose best score was between 10 and 49%.
- Developing %: the percent of unique learners whose best score was between 50 and 69%.
- Proficient %: the percent of unique learners whose best score was between 70 and 89%
- Advanced %: the percent of unique learners whose best score was between 90 and 100%.
- .Novice #: the actual number of unique learners whose best score was between 0 and 9%.
- Aspiring #: the actual number of unique learners whose best score was between 10 and 49%.
- Developing #: the actual number of unique learners whose best score was between 50 and 69%.
- Proficient #: the actual number of unique learners whose best score was between 70 and 89%.
- Advanced #: the actual number of unique learners whose best score was between 90 and 100%.
- Avg Level: The skill level corresponding to the average score. Values include: Novice (0-9%), Aspiring (10-49%), Developing (50-69%), Proficient (70-89%), and Advanced (90-100%).
- Avg Score: This is the average of all the best scores across the score range.
For each skill benchmark in the All Skill Benchmark list, you can view how learners scored on each question to better understand where learners are struggling. These insights help you make more informed decisions about skill measurement and help you to design more targeted learning paths so learners receive the right content to close specific proficiency gaps.
In addition, if you are creating custom benchmark assessments, you can use the question-level analytics to identify questions with low success rates that may be too difficult, ambiguous, misaligned, or otherwise under-performing. You can use the data to refine or replace problematic questions and improve the reliability of your benchmarks.
To access question-level reporting:
-
From the Skill Benchmark Overview dashboard, scroll to the All Skill Benchmark section.
-
Locate the skill benchmark in the list and from the Action menu on the right side, select View question-level report. The report opens.
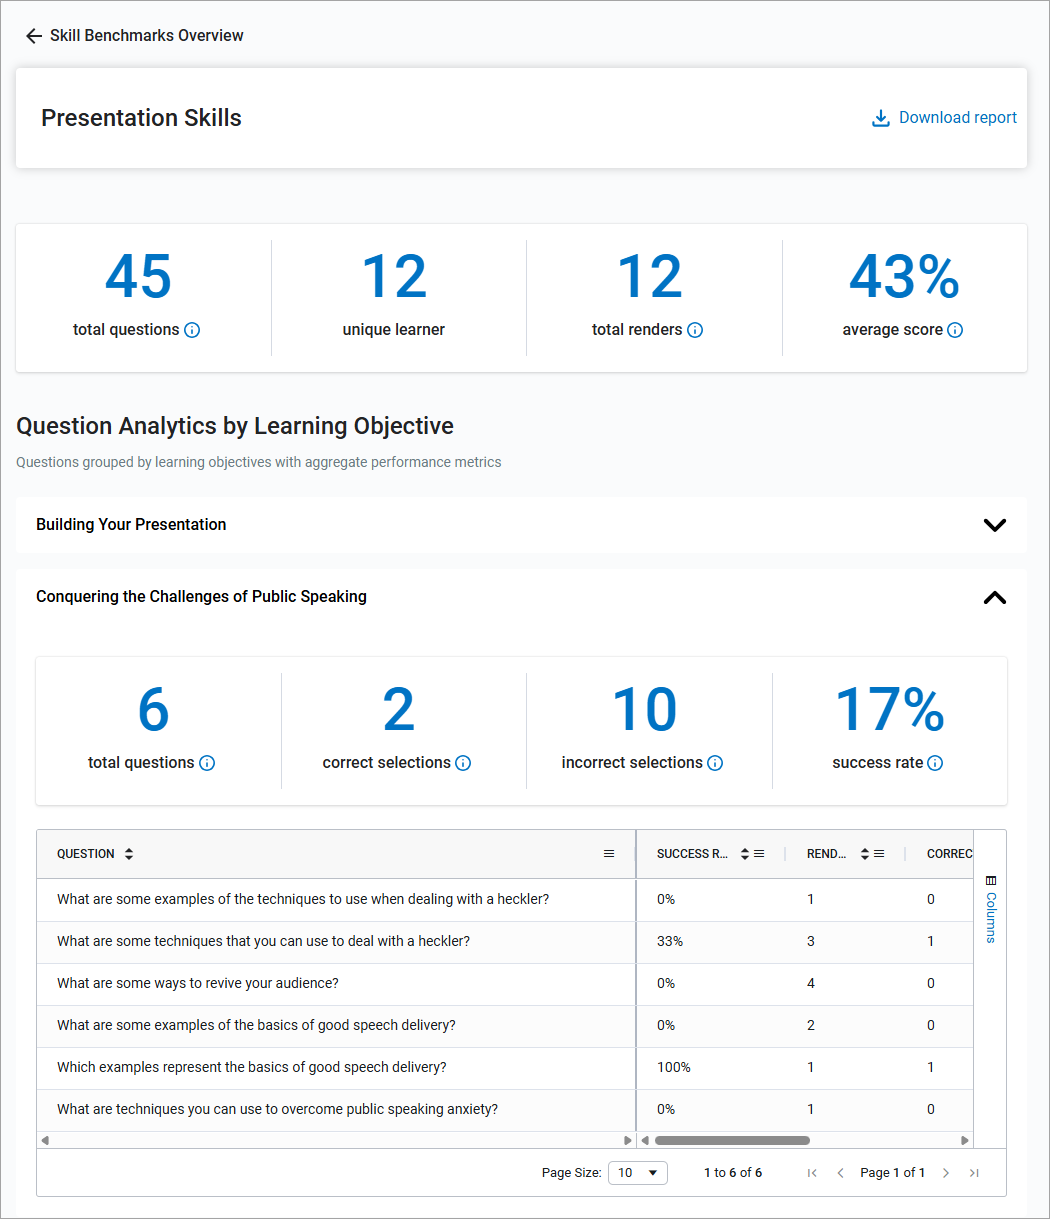
The information you see at the top of this report includes:
- Total questions: The total number of questions associated with the skill benchmark. Each learner may not have had to answer each question depending on how large the pool of questions is.
- Unique learners: The number of unique learners who took this skill benchmark. If the learner took the skill benchmark more than once, they are only counted once.
- Total renders: This is the total number of attempts on the skill benchmark. If a learner took the benchmark twice, it is counted twice.
- Average score: This is the average of all scores for every learner. If one learner took the benchmark multiple times, each score is counted in the average.
In the Question Analytics by Learning Objective section you see the following for each objective associated with the benchmark:
- Total questions: The total number of questions associated with the objective.
- Correct selections: The number of times learners got the right answers across all questions across all attempts.
- Incorrect selections: The number of times learners got the answers wrong across all questions across all attempts.
- Success rate: This is the percent of all correct responses compared to the total number of responses or renders.
For each question within the objective, you also see the number of times the question was answered (renders), its success rate (the percent of correct answers to total renders), the number of correct responses, and the number of incorrect responses.