Activity Dashboard
The Activity dashboard provides key metrics on how utilization progresses for each type of learning modality. You can filter this dashboard by date range and audience to assist in understanding learning trends. Each asset type (such as courses and books) has its own table to show you more detailed data.
Dashboard Insights
The Activity Dashboard gives you insights into the most popular types of content on your platform. You can:
- See how many times learners access each of the different content types. Use this information to gain insight into the types of content your users prefer.
- Filter the dashboard by audience to see how content accesses differ between different audiences. Remind managers of audiences with lower content accesses to assign learning to their teams in order to promote growth.
- Gain insights into not just how many content accesses there are on your platform, but also how many different learners are accessing content. You may have high numbers of total accesses, but only a few users in your organization are actually contributing.
Get Started
To access this dashboard and customize it for your needs:
- From the left navigation bar, select Analytics. Switch to the All dashboards tab.
- Select Activity.
- The dashboard displays with the default filters. You can change any of the filters from the top of the page and then select Update to customize the dashboard.
- Select Use default filters to reset all filters to default.
Filters
You can filter data on this dashboard by date and audience.
- Date filters: Use these to specify the data on your Activity dashboard.
- Date Range: Filters the data by a specified range of dates that you select from the drop-down list.
- Start: Instead of using a Date Range preset, use this to specify a start date. When you enter a Start date, the Date Range Presets filter changes to Custom.
- End: Instead of using a Date Range preset, use this to specify an end date. When you enter an End date, the Date Range Presets filter changes to Custom.
- Audience: Predefined group of users. Enter the name of an audience and then select it from the list. You can display the data for multiple audiences at the same time by entering more than one audience name. You can select up to 20 audiences.
If you set the date to Start on September 1 and End on October 1, only the platform data within the September 1 - October 1 time period is shown.
About this Dashboard
This dashboard contains the following areas:
-
 Summary table
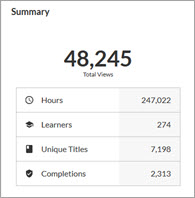
The Summary table provides a complete overview of all the activity in the platform across the different types of content. It sums all individual content boxes in this one box for a big picture view.
- Total Views: The number of unique learner visits in the platform (for example, if a learner accesses a page on Tuesday, then again on Thursday, that counts for 2 unique visits).
- Hours: The total number of hours spent on content including courses, books, book summaries, audiobooks, audio summaries, and videos.
- Learners: The number of distinct learners accessing the asset types.
- Unique Titles: The total number of distinct assets (titles) accessed by learners. If a learner launches the same video in both the video-only player and as part of a course, that is counted as one unique title.
- Completions: The total number of completions for all asset types shown on the page. This is different than what is shown on the Executive report because the Executive report only includes completions of videos launched in the video-only player but not videos launched from within course.
-
Courses table
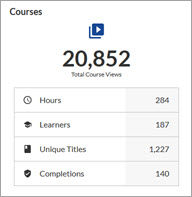
The Courses table provides an overview of course-related activity in the platform. Activity for courses reflects the time spent in course videos and course assessments.
- Total Views: The number of unique views of Skillsoft Platform courses within a session totaled across all sessions. For example, if a learner launches two videos from the same course within the same session, that is counted as one course view. If the learner logs out and back in and launches the course again, that is counted as another view and added to the first view, for a total of two views. The course gets a view when a learner accesses at least one video, module, or assessment within a session. Views are not double-counted based on different kinds of activity within the same session. If a video is launched in the video-only player, that view is not counted as a course view.
- Hours: The total number of hours spent on content within the course including time on videos, modules, and assessments.
- Learners: The number of distinct learners who have launched a course and played a video, accessed a module, or launched the course assessment.
- Unique Titles: Number of unique courses that have had a video, module, or assessment launched.
- Completions: The total number of course completions across the platform.
-
Content type tables
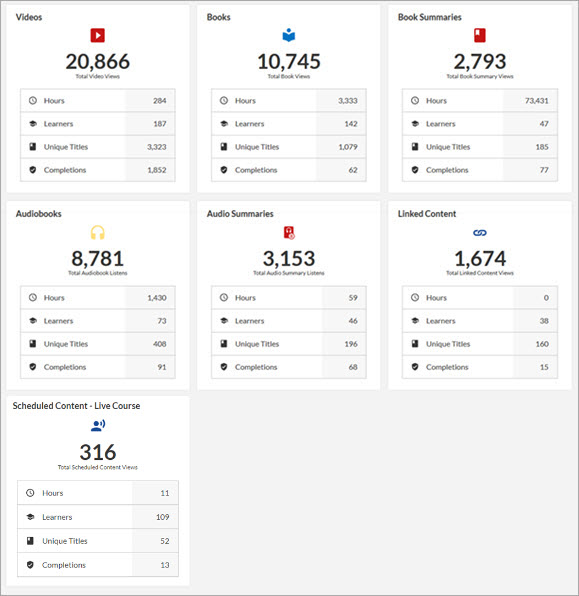
These tables include activity for specific content types: videos, books, book summaries, audiobooks, audio summaries, linked content, and scheduled content. Linked content includes labs and TestPreps along with custom content linked items. Scheduled content includes all live course (ILT) items you configured. (Other activities in Skillsoft Percipio Platform that are described as practice, such as within the Leadership Development Program area, are not included here.)
- Total Views: The number of unique asset-specific views.
- For the Videos card, this includes all video launches, which means the number includes both videos played from within a Skillsoft course or launched separately in the video-only player. For example, if a learner launched the same video once from within the course and once in the video-only player, that would be 2 views.
- Hours: The total number of hours spent engaging with the specific asset type. A couple of things to note:
- For Linked content card, the platform cannot calculate hours for linked custom content items that are not track-able.
- For the Videos card, this includes all video launches, which means the number includes both videos played from within a Skillsoft course or launched separately in the video-only player. For example, if a learner launched the same video once from within the course and watched it for 5 minutes, and once in the video-only player and watched it for 10 minutes , that would be 15 minutes or a quarter of an hour.
- For the Courses card, this includes only when learners launch a course. If a learner launches a course video in the video-only player, that time is not counted as part of the course hours.
- Learners: The number of distinct learners who have launched the specified content type.
- Unique Titles: The number of the specific asset type accessed by learners.
- For the Videos card, this includes all video launches, which means the number includes both videos played from within a Skillsoft course or launched separately in the video-only player. For example, if a learner launches 2 videos from a course and a third separate video in the video-only player, that would be 3 unique titles. And, if the learner launches one of those 2 same videos from the course in the video-only player, that would only count as 2 unique titles.
- Completions: The number of completions by learners for each asset type.
- When looking at the Videos card, the total completions includes both videos launched in the video-only player and each video played within the course player.
- Completions criteria are defined per asset type.
- Total Views: The number of unique asset-specific views.