Executive Dashboard
The Executive dashboard is a framework for showing value and providing insights about learning success over a specified date range and for a specific audience. It is designed to show how your people are moving along the learning journey from adoption through to achievement.
Dashboard Insights
The Executive dashboard provides insights on how much time users are spending learning, how many content items they access, and what they are achieving. You can:
- Use the date filters to see how engagement on your platform has changed over time. If engagement is low, consider creating new assignments or reminders to re-engage learners.
- See how many badges your learners are earning. Share this information with stakeholders and managers to show how your Skillsoft Platform is promoting growth in your organization.
- Get insights about the number of content items being accessed by learners. Encourage users to expand their learning and find new content items or types of content to promote their learning.
Get Started
To access this dashboard and customize it for your needs:
- From the left navigation bar, select Analytics. Switch to the All dashboards tab.
- Select Executive Dashboard.The dashboard page displays.
- The dashboard displays with the default filters. You can change any of the filters from the top of the page and then select Update to customize the dashboard.
- Select Use default filters to reset all filters to default.
- Once you set filters, you can download the dashboard as a PDF by selecting the Download dashboard as PDF button. The PDF displays the data based on the filters you have selected.
Access the Executive Dashboard Report
An option for the Executive dashboard is a corresponding report. This report displays the data month over month for the date range you select.
To access the Executive dashboard report:
- From the left navigation bar, select Analytics. Switch to the All dashboards tab.
- Select Executive Dashboard.The dashboard page displays.
- Select the Executive Dashboard Report button.
- Enter a date range and audience filter. The default view is all audiences and six month.
- Optionally, select Download report to further analyze the data in your own spreadsheet application.
The information in the Executive dashboard report shows unique users month by month. Because some users may have accessed the system in more than one month, totaling the values across the months will not equal unique values reported on the dashboard for the same period.
Filters
The following filters are available for the Executive dashboard:
- Date filters: Use these to specify the data on your Activity dashboard.
- Date Range: Filters the data by a specified range of dates that you select from the drop-down list.
- Start: Instead of using a Date Range preset, use this to specify a start date. When you enter a Start date, the Date Range Presets filter changes to Custom.
- End: Instead of using a Date Range preset, use this to specify an end date. When you enter an End date, the Date Range Presets filter changes to Custom.
- Audience: Predefined group of users. Enter the name of an audience and then select it from the list. You can display the data for multiple audiences at the same time by entering more than one audience name. You can select up to 20 audiences.
If you set the date to Start on September 1 and End on October 1, only the platform data within the September 1 - October 1 time period is shown.
About this Dashboard
The four distinct segments of measurement on the dashboard are:
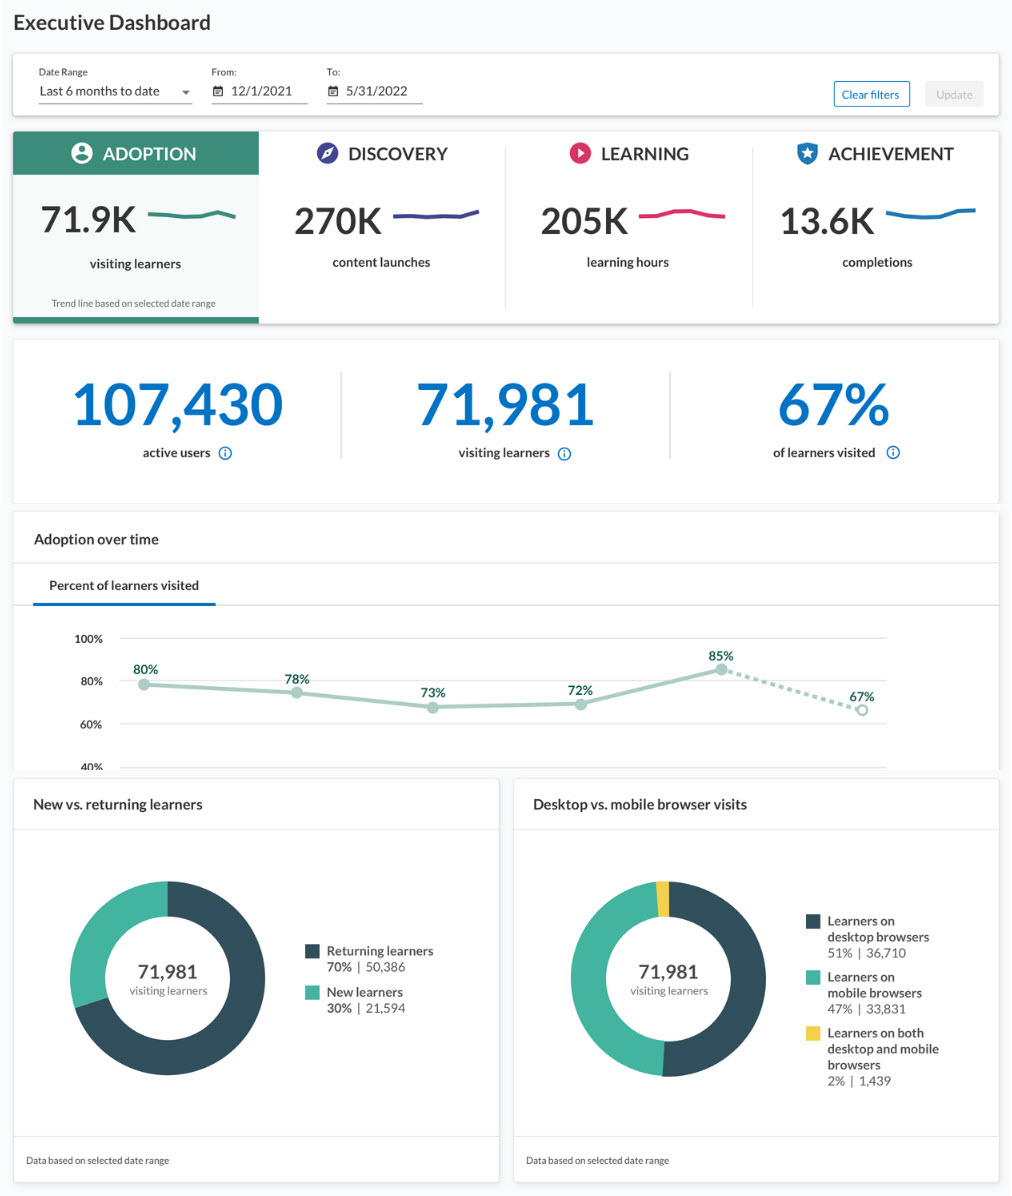
- Adoption: Measures the percent of active users who visited the site over the specified time period. It shows how many are new versus returning users and what device they are using.
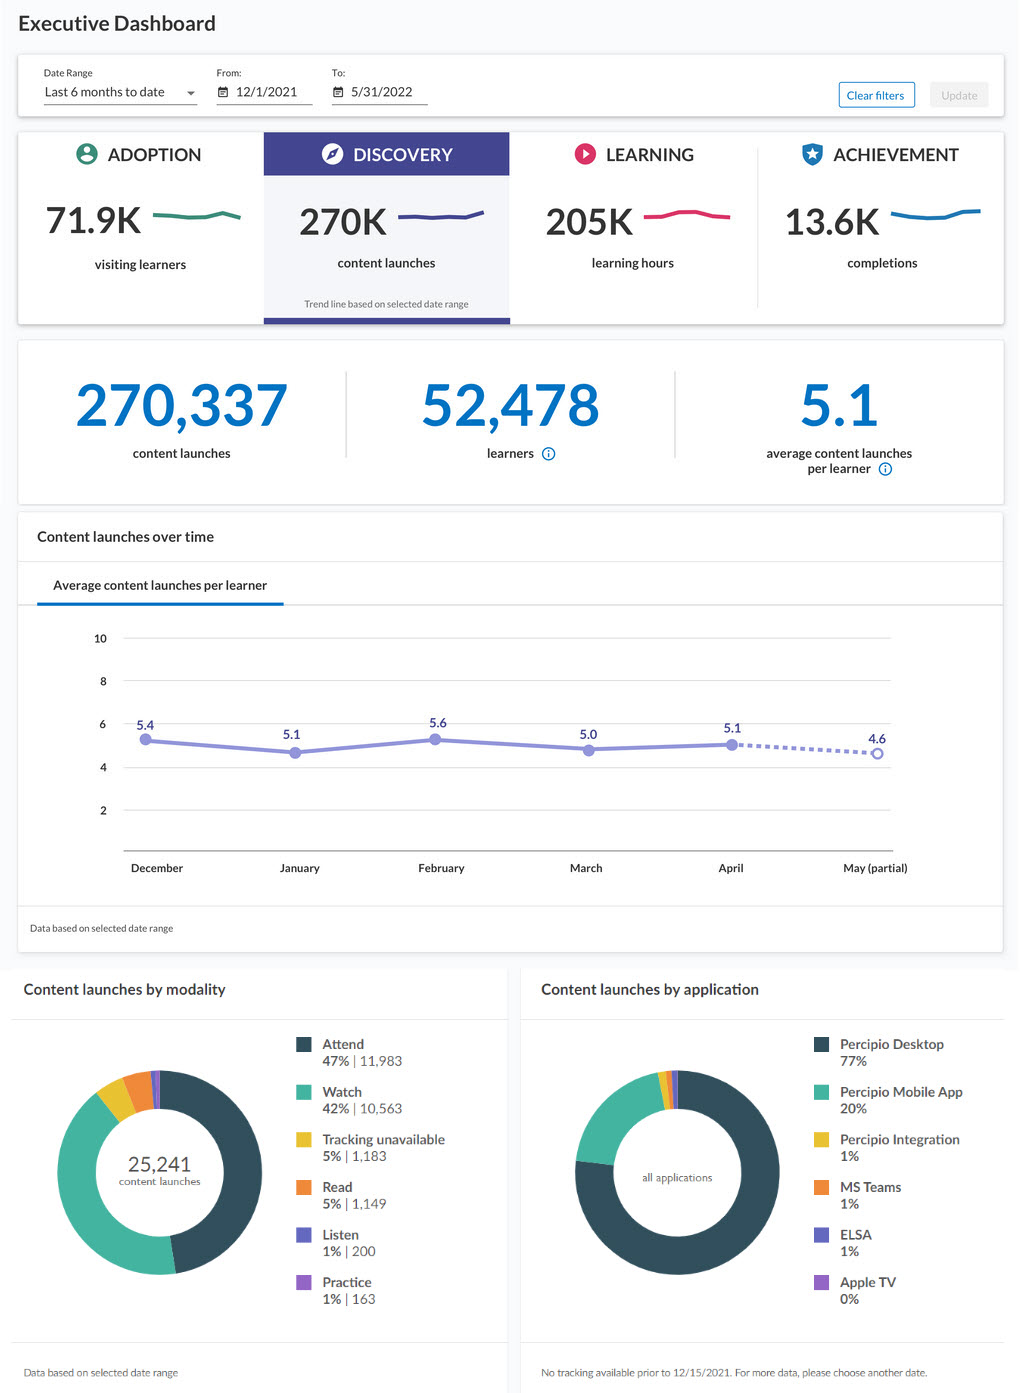
- Discovery: Measures the average number of content accesses per learner who visited the site.
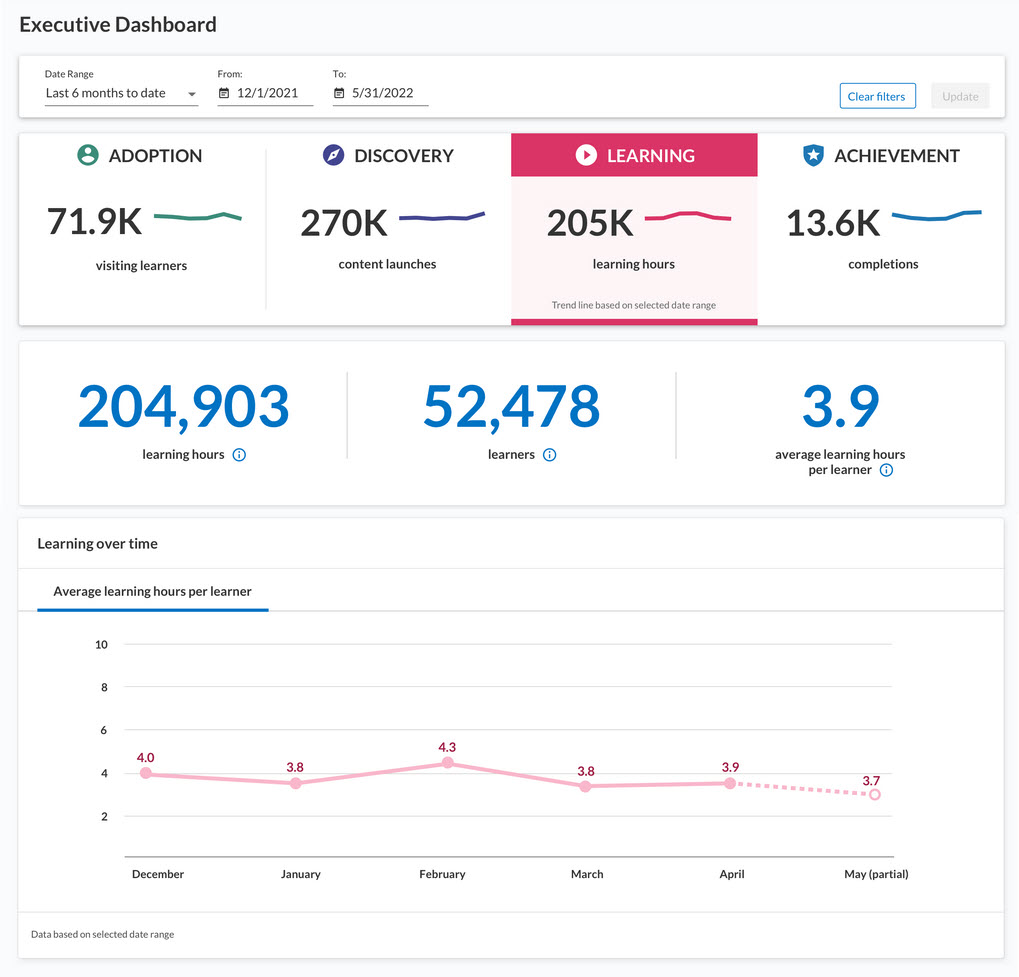
- Learning: Measures how much time learners spend in the content they launch.
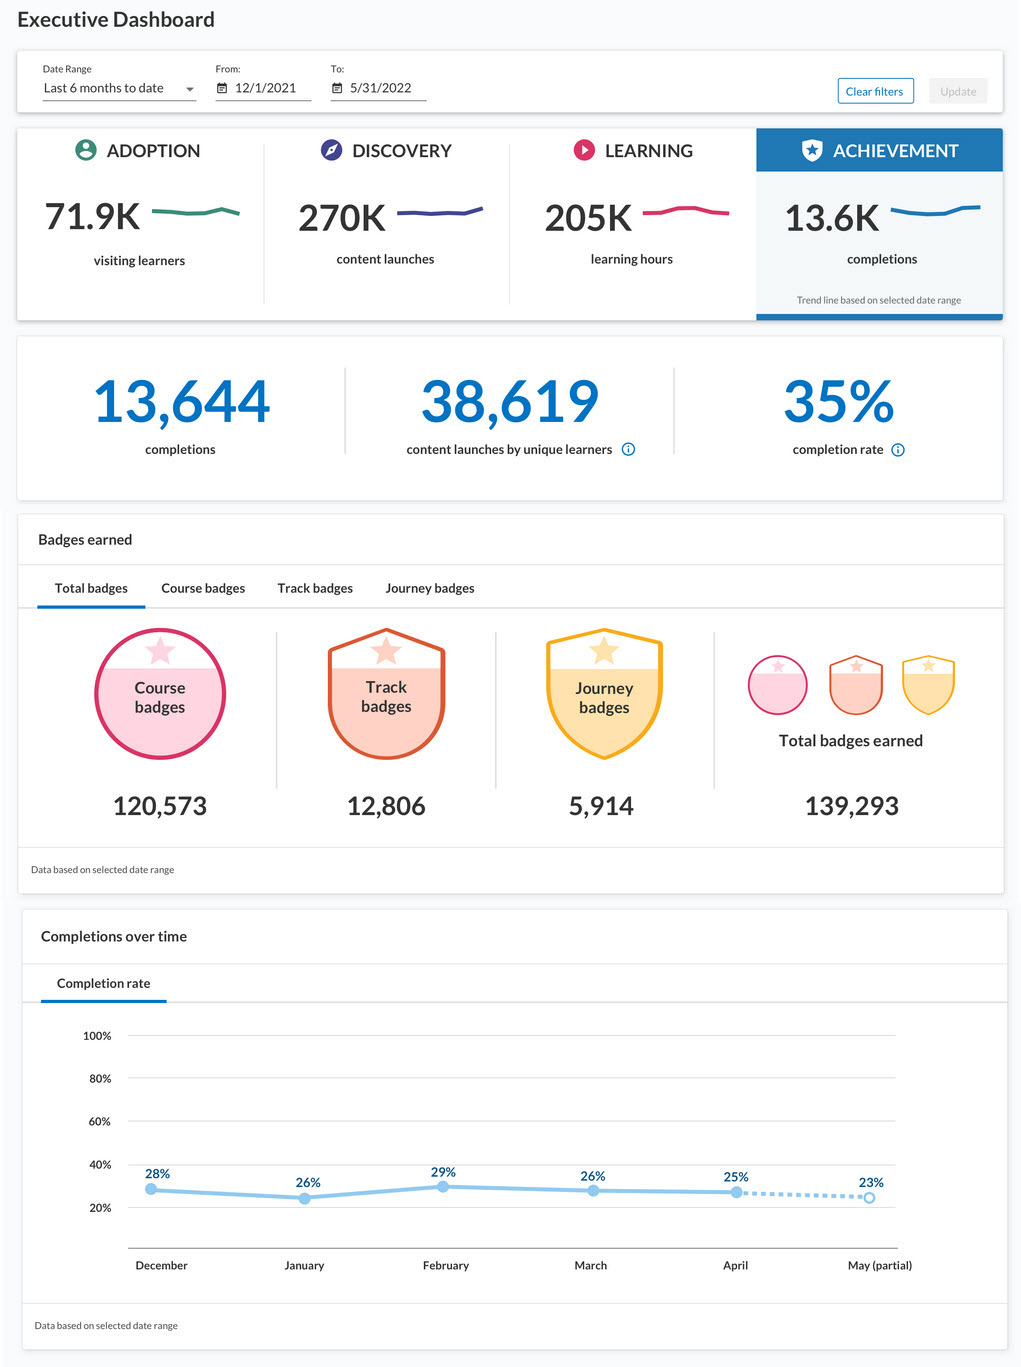
- Achievement: Measures completions as the total number of completions divided by the total number of starts, not accesses.
You can see a month-over-month view of all details from each segment in the Executive Dashboard report. All data from each of the segments is presented in a table format, one row per month. Use your data analysis tools to determine trending patterns.
The measure of adoption is the percent of active users who visited at least one page in the platform during the selected time frame.
How to use
Adoption is a leading indicator for measuring how users are achieving learning at your organization.
Leverage the graphs and trends to analyze the effectiveness of your marketing programs used to entice users to the platform. Review the charts to get insight on if users are coming back to the platform (return users) over time and their preferred device for accessing the platform.
Use the data to tailor your programs. For example, if you see a lot of returning users, but not a lot of new users and your adoption rate is low, perhaps it is time for a new marketing campaign targeting active users who have not yet logged into the platform.
Number block at the top
Total active users: a person whose Skillsoft Platform user account had a status of active at some point during the date range. Active users represent the eligible learning population.
Visiting learner: an active user who logged into the platform and viewed at least one page during the specified date range. If a visiting learner logs into the platform more than once during the specified date range, they are only counted one time. If the learner logged in prior to the date range and didn't access any pages within the report date range, they are not counted as a Visiting learner; they had an active session, but in order to count as a visiting learner, they need to also have performed an activity such as navigation or search.
% of Learners visited: Total active users divided by the total number of unique visiting learners.
Adoption over time
The line graph shows trends over the previous six months from the specified End date. If six months of data is not available, the platform shows the data that is available.
The data point shown for each month is calculated based on data from the first through to the last day of that month. These numbers can fluctuate month to month if you have layoffs, a hiring spree, or launch some type of marketing campaign to promote learning.
The value you see for September is calculated using data from September 1 to September 30. If a person's account was active at any point during September they are counted in the Active users total for September. If any of the active users in September visited a Skillsoft Platform page at least once, they are counted as a visiting learner. If a visiting learner logs into the platform more than once during that September time frame, they are only counted once as a visiting learner. Dividing total active users by total unique visiting learners gives you the percent visited for September.
New vs returning visitors
This section contains two views. Select the tab to change the view.
-
Monthly trend: The bar chart shows for each month in the date range how many of the visiting learners accessed the platform for the first time — New visitors. It also shows how many users came back after visiting it a first time not within that month — Returning visitors.
-
Aggregate: This donut chart shows the total number of visiting learning broken out by the total number of new users versus returning visitors within the date range.
If the date range filter is set from March 1 through August 31, you see the number of new users and the number of returning users for each month within that date range. A new user in March could be a returning user in April. For every month that a user accesses the platform, they are counted as a returning user except for the first month that they access it, even if that first month is outside the date range filters. If the first month is within the date range filter, then they are considered a new learner for that month.
Desktop vs mobile browser visits
This chart shows how many of the visiting learners accessed the platform from a desktop browser, a mobile browser, or both. Learners who show up in the both category means they logged into the platform more than one time during the specified time period. Learners in the both category are not counted in the desktop only or mobile only categories.
Mobile browser is when a learner launches the Skillsoft Platform on a mobile device using the browser on that device. It does not count when a user launches the platform via the mobile app, the MS Teams app, or the Apple TV app.
The date range is for May 1 through October 31 and you have 30,000 unique learners who visited the site. In the Desktop vs Mobile browser donut, you see 15,000 desktop, 10,000 mobile, and 5,000 both. That means 15,000 of your visiting learners accessed the platform only from a desktop browser between May 1 and October 31, and 10,000 of your visiting learners accessed the platform only from a mobile browser, and 5,000 visiting learners used both types of browsers.
The ability to find the right content is integral to a learner obtaining new skills. A part of the discovery process might mean a learner finds a piece of content, launches it to see if it is a good fit, but then exits and bookmarks it to consume later. The Discovery tab shows you how many users launched a content item within the time frame specified.
How to use
Discovery data can show you if learners are taking ownership of their own learning. If you see a low average for content accesses per learner, this may indicate the learners are only launching what they have been assigned or what has been shared with them and they are not branching out to explore and learn beyond that. If that is the case, you might try offering a scavenger hunt contest to get learners more comfortable with the platform.
Looking at the trend data over time, you can get a sense if any marketing programs caused users to launch the number of content items you are promoting.
Number block at the top
CONTENT ACCESSES: The total number of times within the filtered date range that content was accessed. Content items counted include: courses, videos launched in the video-only player, modules launched outside a course, books, audiobooks, book summaries, audiobook summaries, skill benchmarks, testpreps, labs, Skillsoft live courses (including bootcamps and leadercamps), live events, and custom AICC/SCORM items. For example:- If a user launches the same asset twice in the same day, it counts as 2 accesses.
- If a learner launches three different assets on the same day that is counted as 3 accesses.
- If two learners each launch four different assets on four different days within the date range, that is counted as 8 accesses.
- With regards to courses, Skillsoft courses are made up of child assets such as videos, knowledge checks, modules, and assessments. When a learner launches a course, that is counted as one Content access. Each of the child assets within the course that the learner proceeds through do not get counted as a Content access, they get counted as a Child content access.
- If a learner launches a video in the Video only player, that is counted as a Content access.
Learners: The number of unique individual visiting learners who launched at least one content item within the specified time frame. For the Executive Dashboard, a learner is a user who launches content. If a user has an active account, but does not launch content, they are not yet a learner.
Average content accesses per learner: The Content divided by the number of learners.
Content Accesses over time
The line graph shows trends over the previous six months from the specified End date. If six months of data is not available, the platform shows the data that is available.
The data point shown for each month is calculated based on data from the first through to the last day of that month. These numbers can fluctuate month to month if you have layoffs, a hiring spree, or launch some type of marketing campaign to promote learning.
The value you see for March is calculated using data from March 1 to March 31, while the value for April is calculated using data from April 1 to April 30. The value you see for each month divides the Content accesses by learner by day by the number of learners for that month span and displays the average content accesses per learner for each month over the six month time period.
Content Accesses by modality
This chart shows the breakdown by modality for all the content items launched within the time frame specified. For each modality, you see the number of items launched and the percentage of the whole.
- Attend: includes live courses and live events
- Watch: includes courses and videos
- Read: includes books and book summaries
- Listen: includes audio books and audio book summaries
- Practice: includes labs and test preps
- Other: includes content items where a modality is not specified
Use this data to understand what modality learners prefer so you can better target learning opportunities to their style or use it to understand the less popular modalities and then work to promote those.
Content launches by application
This chart shows which application the learners used to access Skillsoft Platform content. It shows the breakdown by application for all the content items launched within the time frame specified. For each application the learner used to launch content, you see the percentage of the whole. Skillsoft Platform Integration is when a learner launches content from an LMS you integrated with the Skillsoft Platform. The content launches by application data is only available starting from December 15, 2021.
Use this data to understand from where learners are accessing the platform. Use this data in combination with the modality data to understand your users' behavior and what they favor so you can better target learning opportunities or run campaigns to promote lesser used modalities and applications.
A good prediction of whether learners are actually learning, is to measure the time spent in the content. From our earliest school days we know that the more time you spend with something the better you get.
Currently, we can track learner’s time in content for Skillsoft videos, YouTube videos, courses, books, audiobooks, audiobook summaries, book summaries, labs, Skillsoft live courses (including bootcamps), live events, and custom AICC/SCORM items. We don't track time for users who launch a course and only take the test and don't consume content.
How to Use
When looking at the average learning hours per learner, you can get a sense of whether learners are targeting short bursts of learning when they need it or spending longer to learn new concepts. A lower average means your learners might be coming in to learn how to do a particular task and leaving when they have the information. A higher average might mean they are spending more time to learn a new skill or concept.
In addition, you can compare the average learning hours per learner with the time it takes to complete different assignments and then determine if your assignments are manageable for your audiences and adjust as necessary. If your average hours is low, perhaps you can start promoting full courses, then track the average hours over time to see if it goes up.
Look at the average learning hours relative to the programs and promotions you are running to see if the numbers align. A low average is not necessarily bad if you are promoting short bursts of content over long periods of time.
Number block at the top
Learning hours: The total number of hours learners spent in a content item that supports time tracking. Items that support time tracking include Skillsoft videos launched independently in the video only player, YouTube videos, courses, books, audiobooks, audiobook summaries, book summaries, labs, Skillsoft live courses, and live events. This number should equate to the total learning hours in the Executive report.
Learners: The number of unique individual visiting learners who launched at least one content item within the specified time frame. For the Executive Dashboard, a learner is a user who launches content. If a user has an active account, but does not launch content, they are not yet a learner.
Average learning hours per learner:Total learning hours divided by the number of learners during the time period specified.
Learning over time
The line graph shows trends over the previous six months from the specified End date. If six months of data is not available, the platform shows the data that is available.
The data point shown for each month is calculated based on data from the first through to the last day of that month. These numbers can fluctuate month to month if you have layoffs, a hiring spree, or launch some type of marketing campaign to promote learning.
The value you see for September is calculated using data from September 1 to September 30. If a person logged into the platform and launched a video, course, book, lab or live event, the platform adds the amount of time spent in each of these items to the total learning hours. Any person who logged into the platform during the month and launched a content item is a learner. Dividing total learning hours by the total number of unique learners gives you the average learning hours per user for September.
When a learner completes a content item, there is a sense of pride and accomplishment, and thus looking at completion rate and the number of badges earned can give you a sense of your employees overall learning health.
How to Use
Using completion rates and number of badges earned, you can challenge your learners to reach higher and really showcase what they learned. Offer promotional challenges between teams to spark a competitive spirit.
View badge details for courses, tracks, and journeys to see what content your learners completed. If the items shown are in alignment with your business objectives, assignments, and promotional campaigns, you know your program efforts are paying off. If the items shown do not correlate to any known promotions or assignments, investigate to see what is driving the need and how you may further support it.
Number block at the top
TOTAL COMPLETIONS: When a learner meets the completion criteria for a content item, that is considered one completion. Total completions is the total number of times learners meet the completion criteria for any of the following content items: courses, books, audiobooks, book summaries, audiobook summaries, Skillsoft live courses, labs, live events, Skillsoft videos and modules launched in the video-only or module-only player, journeys, and any type of custom content. Completions do not include tracks, dynamic content, or Skillsoft videos or modules viewed while in the course player.
Unique content accesses by learner: When a learner starts a content item for the first time, that is considered a content access. If a learner launches the same content item multiple times within the specified date range, it counts as only one content access, however, if the learner restarts the content item, it counts as an additional content access. If a single learner launches two separate items within the date range that is counted as two accesses. If a learner starts an item the first time outside the date range and a second time within the date range, the item is counted as a content access. If two different learners start the same content item within the date range, that is counted as two accesses.
Completion rate:Total completions divided by content accesses by unique learners.
During the last 6 months, 20 learners launched 1 course one time, and 10 learners completed the course in that first launch attempt. That is a 50% completion rate. If 6 of the learners launched the course on multiple occasions within the date range, it is still counted as only one content launch per learner.
Let’s add another course.
During the last 6 months, 20 learners launched 1 course one time and 10 completed the course in that first launch attempt. 30 learners launched another course one time and 0 completed. So you have 20+30 unique learner/content accesses = 50, and only 10 completions, resulting in a 20% completion rate.
Badges earned
This has four tabs providing details on the badges earned by your learners over the selected date range.
Digital Badges are only available for courses, tracks, and journeys, not other content items. Also, not all courses tracks or journeys offer Digital Badges, which is why the number of badges earned may be significantly less than the total completions.
- Total badges: Shows the total badges earned for each badge type: courses, tracks and journeys. It also shows the total of all badges earned.
- Course badges: Shows how many badges earned for each course title that earned a badge.
- Track badges: Shows how many badges earned for each track title that earned a badge.
- Journey badges: Shows how many badges earned for each journey title that earned a badge.
If you have Digital Badges turned off for your site, you do not see this section.
Earning badges can be a sense of pride for your employees. Using the information shown in the Badges earned section, you can help promote learning success in your organization by showcasing numbers over time. You could also create healthy competitions among departments or teams to encourage learning.
Completion rate over time
The line graph shows trends over the previous six months from the specified End date. If six months of data is not available, the platform shows the data that is available.
The data point shown for each month is calculated based on data from the first through to the last day of that month. These numbers can fluctuate month to month if you have layoffs, a hiring spree, or launch some type of marketing campaign to promote learning.
The value you see for September is calculated using data from September 1 to September 30. If a person logged into the platform and completed a course, book, live course, lab or live event, the platform adds that as a completion to the total number of completions. A content launch is when any person who logged into the platform during the month, launched a content item. If the learner launched the same content item again within September, that is not counted as a content launch. Dividing total completions by the total unique content accesses gives you the completion rate for September.