Feature Usage Report
The Feature Usage Report shows how many users access specific features on your Skillsoft Platform and how often. The features included in this report are:
- AI Assistant
- Study Groups
- Playlist
Report Insights
Use the Feature Usage Report to:
- Gain insights into how many users are using specific features on your Skillsoft Platform. Consider using this information to encourage users to explore other features to assist their learning.
- Discover which users are accessing which features. See how utilizing features might impact a user's learning by cross referencing with activity reports.
- Use filters to see how feature usage has changed over time, and which of your audiences are using certain features the most.
- Discover who might be champions of a particular feature that can help promote its usage across your company.
Get Started
To get started using the Feature Usage report:
- From the left navigation bar, select Analytics > All Reports > Feature Usage.
- Set filters at the top of the page to narrow down that data you are viewing. Select Apply filters. The report updates.
- Use the download button in any section to download a CSV of that section of the report to your device. For the two sections with charts, you also have the option to download the chart as an image.
- For the Feature Usage table summary and View learners detailed data view, you can set up a report schedule and get an email reminder when it is ready to view.
To help make the relevant data as accessible as possible, this report allows you to move and resize the charts and tables on the page. To move and resize the components on the page:
- Locate the chart or table you want to move.
- From the left of the title, click and hold the the 6-dot icon.
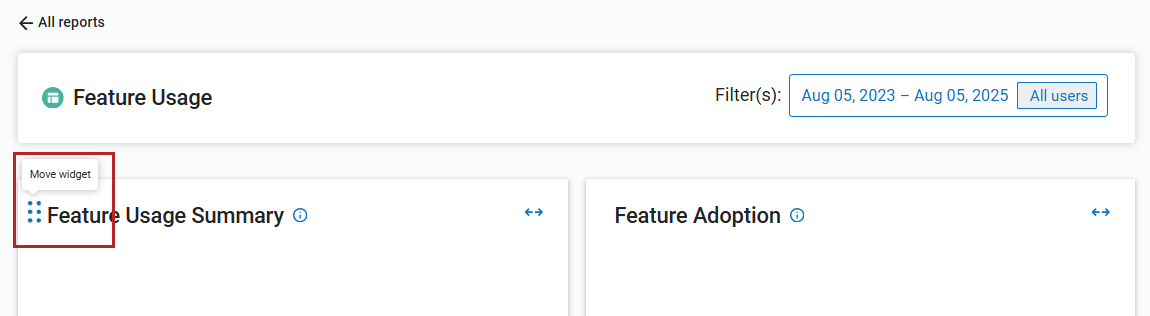
- Drag the component to the area you want on the page.
- You can expand the component to full or half width by clicking on the arrows to the right of the title. After you make the changes, they remain for next time you log into this report.
Filters
The report displays with default filters selected. Select the filters drop-down to see all filters available for this report.
You can use the following filters for locating specific data:
- Date filters: The date filters apply to all views of this report.
- Date Range Presets: A drop-down list of date ranges that filters the data to the selected range. Select Custom to enter specific dates.
- Start: Instead of using a Date Range preset, use this to specify a start date. When you enter a Start date, the Date Range Presets filter changes to Custom.
- End: Instead of using a Date Range preset, use this to specify an end date. When you enter an End date, the Date Range Presets filter changes to Custom.
- Audience: Predefined group of users. Enter the name of an audience and then select it from the list. You can display the data for multiple audiences at the same time by entering more than one audience name. You can select up to 20 audiences.
- Show inactive: If you want to include usage and unique users who might have been active within the date range filter, but who have a current status of inactive, select this check box to show data from inactive users.
About this Report
This report has three components.
Feature Usage Summary
The Feature Usage Summary chart shows the features accessed during the specified date range. For each feature it shows the number of unique users who accessed that feature and the total number of times the feature was accessed.
Feature Adoption
The Feature Adoption chart shows the percent of users who accessed a feature within the date range based on the total number of active users today.
For example, if 2000 active users as of today and 1000 of them within the data range accessed the AI Assistant, that would be 50%.
Feature Usage Summary
The Feature Usage Summary table provides additional detail for each feature including the date the feature was first and last accessed even if that date is outside the date range filter. It also shows the number of unique users who accessed the feature and how many times within the date range the feature was accessed.
For each feature within the table, you can select to View Learners to see additional information about how users are using the feature.
Columns
Default Columns for Feature Usage Summary view
You see data for the following columns by default when you view the Feature Usage Summary table:
- FEATURE TITLE: A feature is a specific element of the platform that assists users in their learning, such as AI Assistant and playlists.
- FIRST ACCESS DATE: The first date of all time that any learner accessed the feature.
- LAST ACCESS DATE: The last date of all time that the user accessed the feature.
- UNIQUE USERS ACCESSING: The number of unique users that accessed the feature in the specified date range.
- TOTAL FEATURE ACCESSES: The total number of times that the feature was accessed within the specified date range.
- VISITING USERS PERCENTAGE: Of the total number of times the feature was accessed what percent was accessed by unique users. In other words, the percentage of unique users accessing based on total feature accesses. This shows that of all the times the feature was accessed, in general, what percent was accessed by unique users.
Additional Columns for Detailed Views
For each feature listed in the summary view, you can select View Learners to see more details about the users accessing that feature.
The default columns you see are:
- FIRST NAME: The value entered in the First name user attribute. Usually the user's first name.
- LAST NAME: The value entered in the Last name user attribute. Usually the user's last name.
- EMAIL ADDRESS: The value entered in the Email address user attribute; the user's email address.
- TOTAL ACCESSES DURING TIMEFRAME: How many times the user accessed the feature during the specified date range.
- FIRST ACCESS DATE: The first date within the filtered date range that the learner accessed the feature. If the learner accessed the feature on multiple occasions, this date may change based on the date range filters you specify.
- LAST ACCESS DATE: The last date within the filtered date range that the user accessed the feature. If the learner accessed the feature on multiple occasions, this date may change based on the date range filters you specify.
- QUESTIONS: The number of times the user asked the AI Assistant a question in the specified date range. This counts every question asked within a conversation.
- RECOMMENDATIONS: The number of times the user asked the assistant to provide content recommendations for a topic. This does not include recommendations AI provides as part of an answer if not specifically prompted.
- CONVERSATIONS: The number of time the user entered dialog, either text or voice, into the AI Assistant. There could be multiple conversations within a single chat session.
- LAUNCH: The number of times the AI Assistant was launched.
The default columns you see are:
- FIRST NAME: The value entered in the First name user attribute. Usually the user's first name.
- LAST NAME: The value entered in the Last name user attribute. Usually the user's last name.
- TOTAL ACCESSES DURING TIMEFRAME: How many times the user accessed the feature during the specified date range.
- FIRST ACCESS DATE: The first date within the filtered date range that the learner accessed the feature. If the learner accessed the feature on multiple occasions, this date may change based on the date range filters you specify.
- LAST ACCESS DATE: The last date within the filtered date range that the user accessed the feature. If the learner accessed the feature on multiple occasions, this date may change based on the date range filters you specify.
- CREATED: The number of study groups created by the user in the given date range.
- ACCEPTED: The number of study groups created by the user that were accepted by those they invited.
The default columns you see are:
- FIRST NAME: The value entered in the First name user attribute. Usually the user's first name.
- LAST NAME: The value entered in the Last name user attribute. Usually the user's last name.
- TOTAL ACCESSES DURING TIMEFRAME: How many times the user accessed the feature during the specified date range.
- FIRST ACCESS DATE: The first date within the filtered date range that the learner accessed the feature. If the learner accessed the feature on multiple occasions, this date may change based on the date range filters you specify.
- LAST ACCESS DATE: The last date within the filtered date range that the user accessed the feature. If the learner accessed the feature on multiple occasions, this date may change based on the date range filters you specify.
- PLAYLISTS DELETED: The number of playlists deleted by the user in the specified date range.
- PLAYLISTS CREATED: The number of playlists created by the user in the specified date range.
- ASSETS ADDED: The total number of content items the user added to playlists in the specified date range.
- ASSETS REMOVED: The total number of content items the user removed from playlists in the specified date range.
- ASSETS LAUNCHED: The total number of times the user launched a content item from a playlist in the specified date range.